
The geopolitical shockwaves from the US-Iran conflict are hitting Solana hard. SOL price tanked over 7% on Monday, sliding from $88 to an intraday low of $81.86 as investors fled risk assets . A brief attempt to breach $90 resistance fizzled, leaving the token down 30% on the monthly timeframe and 44% below 2026 highs . This Solana price analysis examines whether the downturn has further to run.
Solana Price Analysis: The Bearish Signals Stack Up
The technical picture is deteriorating rapidly. On the daily chart, SOL has formed a bearish flag pattern—a classic continuation setup that typically precedes further downside . The Supertrend indicator has flashed red, while Aroon Down sits at 50% , confirming sellers maintain firm control .
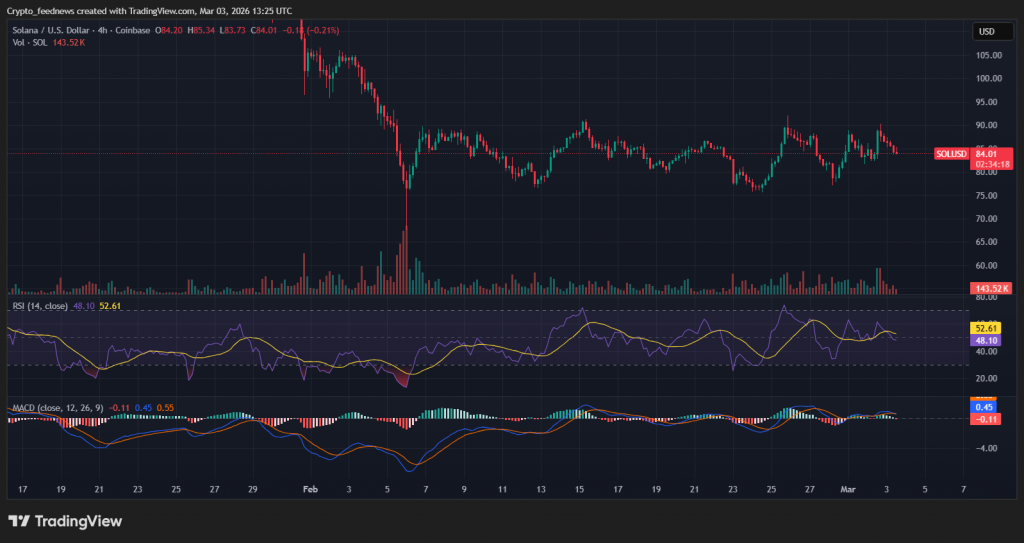
If this momentum persists, the next major target is the Feb. 6 low of $70 . That level represents a 15% drop from current prices and would mark the deepest retracement since the November 2024 lows.
Fundamentals Weaken: Revenue and TVL Slump
The price weakness isn’t occurring in a vacuum. Network data reveals concerning trends:
- Weekly revenue has dropped over 30% from mid-January peaks
- Total Value Locked (TVL) has fallen from $9 billion (Jan. 17) to $6.64 billion currently
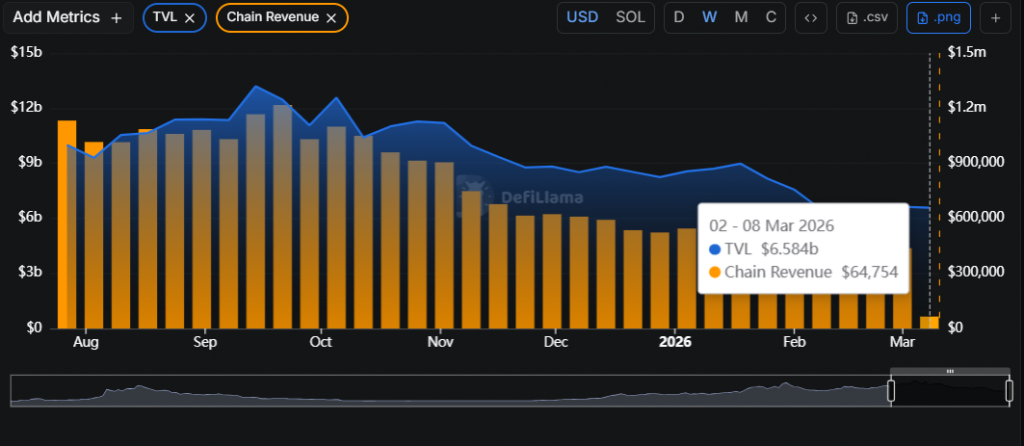
Investors are increasingly concerned that Solana’s explosive growth phase—fueled largely by memecoin speculation—may be ending . The narrative shift from “Ethereum killer” to “memecoin casino” is proving fragile when risk appetite evaporates.
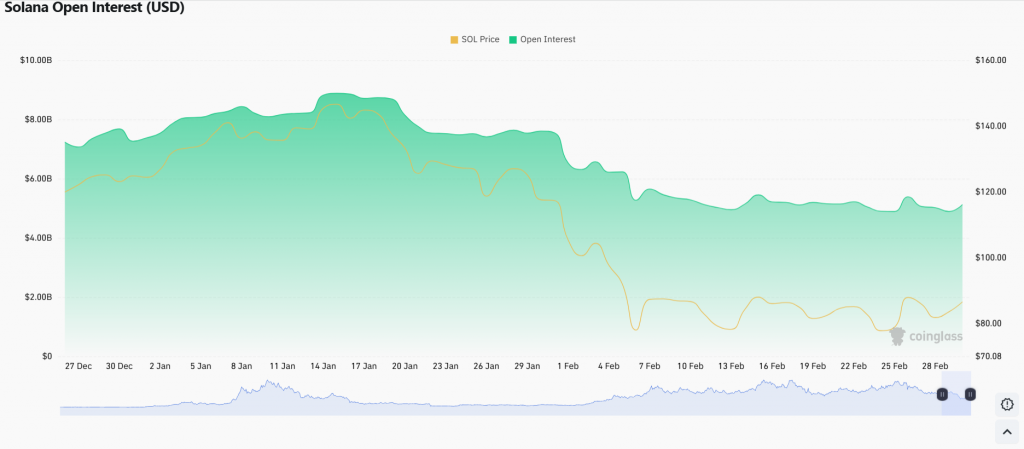
Derivatives Unwind Adds Pressure
The futures market tells a similar story. SOL open interest has plummeted nearly 45% from its January high of $8.88 billion to $4.93 billion . Traders are unwinding positions, waiting for clarity on the geopolitical front before re-entering .
The Macro Overhang: Iran Conflict Spooks Risk Assets
The immediate catalyst remains the escalating US-Iran conflict. Iran’s retaliatory attack on US ships over the weekend sparked a jump in oil prices, raising concerns about higher inflation and a more hawkish Fed . Risk assets like Solana thrive on rate cut expectations and suffer when the Fed must maintain restrictive policy .
Despite the above Bad News Solana ETF has maintained positive net inflows for a full month straight!
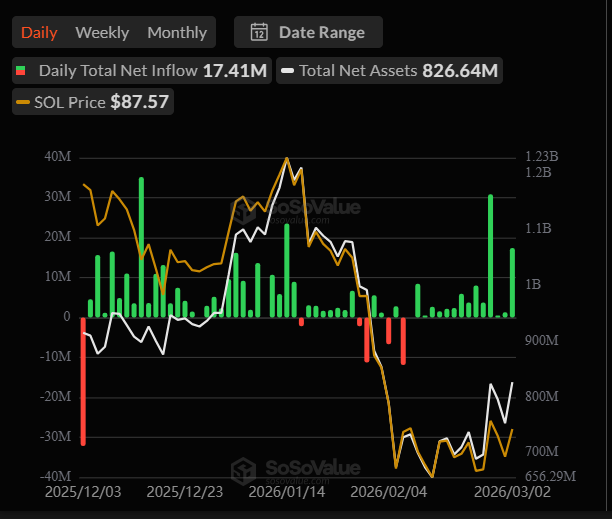
On March 2nd, SOL ETF recorded a staggering $17.41M in daily net inflows . The bulls are in control.
My Thoughts
This Solana price analysis suggests the path of least resistance remains lower. The bearish flag formation is technically sound, the fundamental momentum has stalled, and the macro environment offers no immediate relief.
However, there’s nuance. The open interest collapse means leverage has been largely flushed . When the selling stops, the setup for a reversal improves. The question is timing.
For traders, $70 is the line in the sand. A test of that level would likely attract serious dip-buying interest—both from retail and institutional players who’ve been waiting for this exact entry. If it fails, the next stop is a retest of the $50–$60 range.
For now, caution is warranted. War headlines drive sentiment, and sentiment drives price. Until the geopolitical fog clears, SOL remains vulnerable to further downside.