
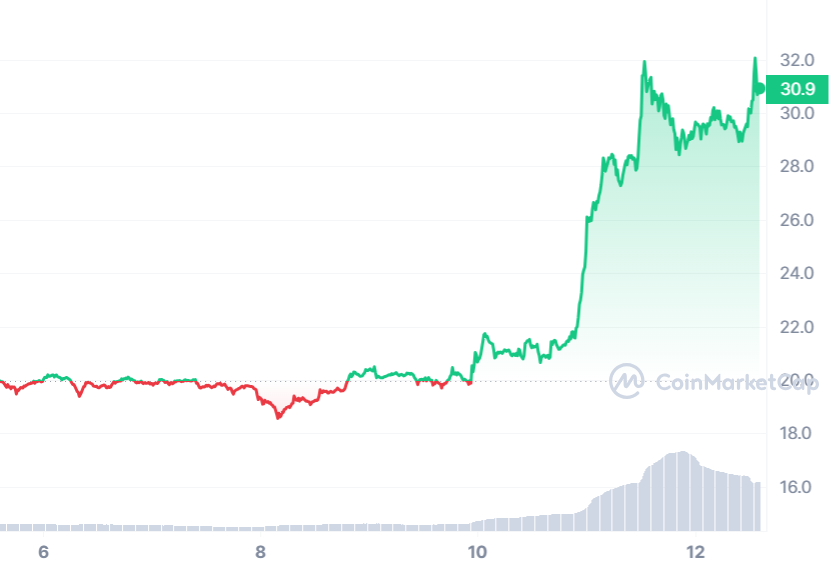
Ethereum Classic (ETC) has emerged as one of the standout performers following the approval of spot Bitcoin exchange-traded funds (ETFs), benefitting significantly from the capital shift from BTC to altcoins.

While the recent surge propelled ETC by nearly 75% since January 8, indicating a break from multi-month resistance levels dating back to September 2022, caution is advised. The Relative Strength Index (RSI) at 76 signals an overbought condition, suggesting a potential correction of around 15%. The breach of the upper Bollinger band, a classic indicator of an impending pullback, aligns with the mean reversion concept, indicating a likely retracement to lower levels.
In such a scenario, Ethereum Classic may experience a downturn, dipping below the 78.6% Fibonacci level at $28.10. Further declines could push the altcoin below the upper Bollinger band at $26.33, testing crucial Fibonacci levels at 61.8% ($24.78). In a more severe downturn, breaching the 50% Fibonacci level would not only negate the prevailing bullish outlook but also challenge the Bollinger centerline at $21.91. Failure to hold this level might lead to a descent towards the 38.2% Fibonacci level at $20.11, or even the 23.6% retracement at $17.22.
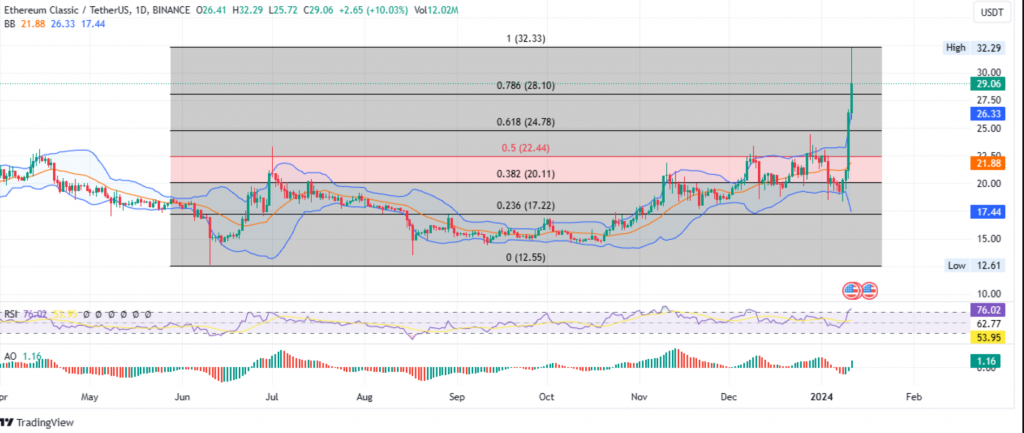
However, the Awesome Oscillator (AO) turning positive with green histogram bars suggests bullish activity. Increased participation from the bulls could propel Ethereum Classic towards higher highs, potentially surpassing $32.29. A decisive candlestick close above this level would invalidate the bearish scenario, indicating a continuation of the bullish trend.