
Ethereum has dipped below $4,500 after its recent rally, but the Ethereum Rainbow Chart suggests significantly higher prices could still be in play. This unique valuation tool helps investors spot long-term opportunities beyond short-term volatility.

Understanding the Rainbow Bands
The chart divides ETH’s price into nine colorful valuation zones:
🟥 Fire Sale: $899-$1,217 (Strong Buy)
🟧 Undervalued: $1,217-$1,680
🟨 Accumulate: $1,680-$2,359
🟩 Still Cheap: $2,359-$3,355
🟦 Steady (Fair Value): $3,355-$4,832 ← Current zone
🟪 HODL!: $4,832-$7,015
🟫 Is this The Flippening?: $7,015-$10,200
⬛ But have we earned it?: $10,200-$14,581
💥 Maximum Bubble Territory: $14,581-$20,778
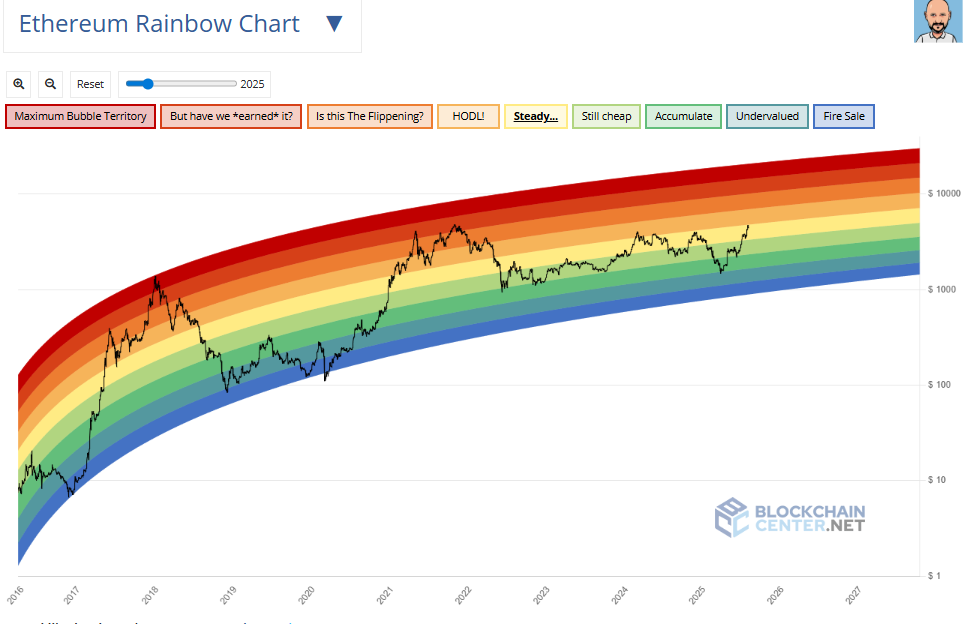
At $4,442, ETH sits comfortably in the “Steady” range – neither overbought nor oversold by historical standards.
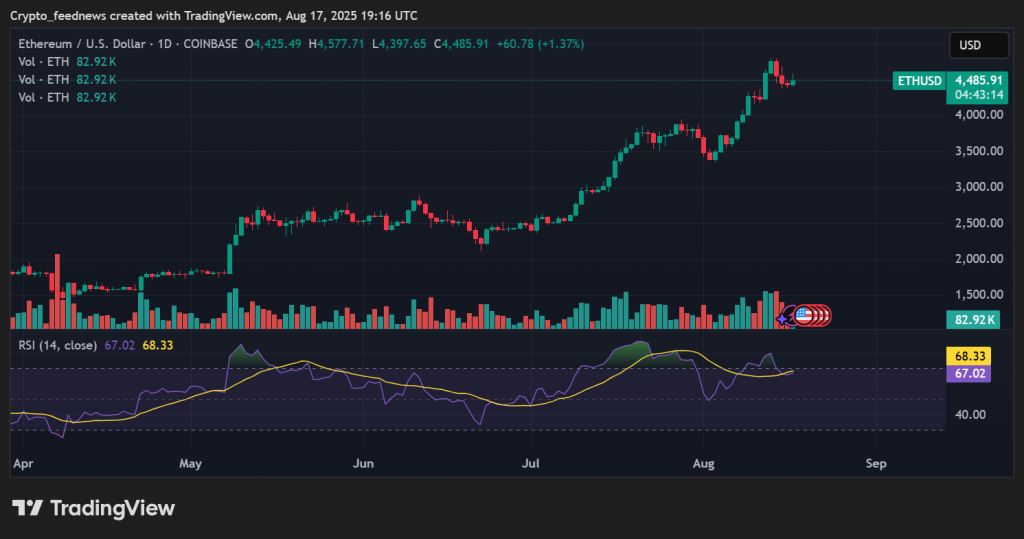
Technical Indicators Remain Bullish
• 50-day SMA ($3,413) and 200-day SMA ($2,596) show strong uptrend
• RSI at 66.86 – Healthy buying pressure (not yet overbought)
• Weekly gain of 4.5% despite recent dip
What’s Next for Ethereum?
The chart suggests two potential paths:
- Conservative Scenario: Holds $3,355-$4,832 through August
- Bullish Breakout: Could test $7,015 “HODL!” zone if momentum returns
While short-term pullbacks are normal, the overall technical picture confirms Ethereum’s bull market remains intact.