
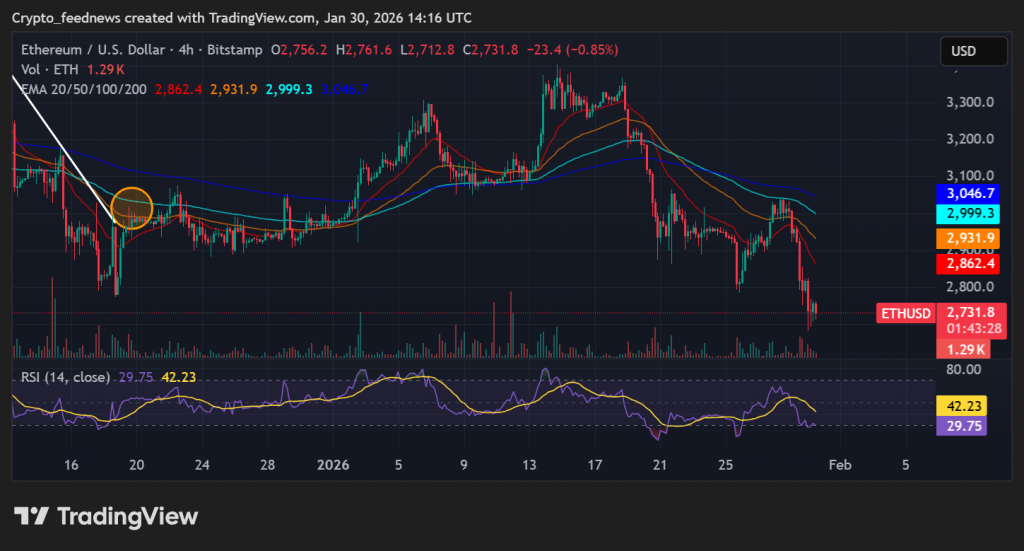
Ethereum has crossed a critical threshold, and the charts are now flashing a severe warning. After a 10% plunge over three days, ETH has decisively broken below the crucial $2,800 support level. This breach activates ominous technical patterns and aligns with bearish on-chain shifts, significantly elevating the near-term Ethereum price risk and opening a path toward much lower prices.
Converging Charts Point to $2,100
The technical picture has turned decidedly ugly. ETH’s breakdown has confirmed two bearish patterns simultaneously: a descending triangle and a symmetrical triangle. Veteran trader Peter Brandt notes the “burden of proof” is now on the bulls. The measured target for these converging patterns sits near $2,100, implying a potential 22% decline from current levels around $2,700.
Immediate support is thin. The next key level is $2,500, which aligns with the 200-week moving average. A failure to hold there would likely trigger the move toward the $2,100 target. The Relative Strength Index (RSI) shows a clear bearish divergence, confirming that selling momentum is building.
On-Chain Data Mirrors Previous Bear Markets
The on-chain story reinforces the technical doom. Ethereum’s Net Unrealized Profit/Loss (NUPL) indicator has shifted from “Anxiety” into the “Fear” zone. Historically, this transition has marked the beginning of extended bearish periods, not short-term corrections.
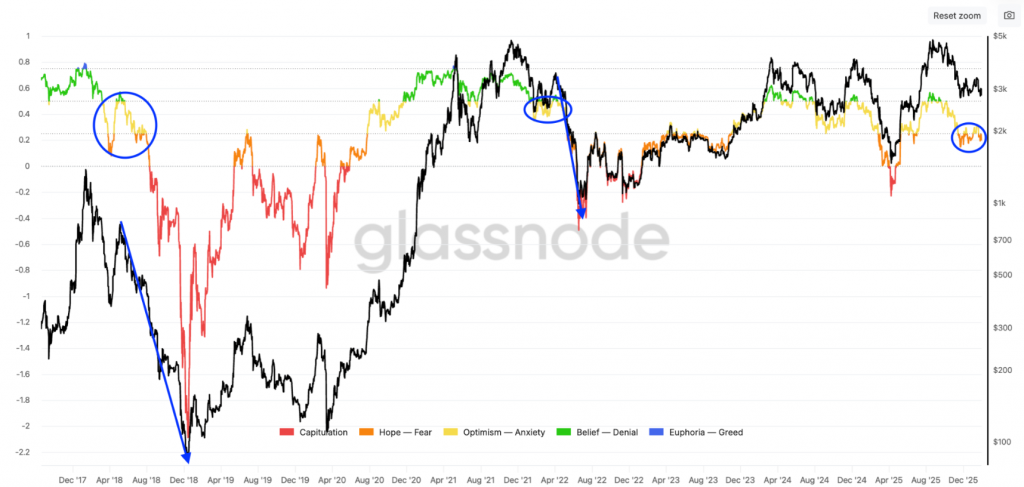
Furthermore, a critical moving average crossover is in play: the 111-day MA has dropped below the 200-day MA. This same signal preceded the brutal bear markets of 2018 and 2022, adding a layer of macro-cycle validation to the current breakdown.
My Thoughts
This is a high-conviction bearish setup. The confluence of multiple timeframes and data types is rare and should not be ignored. While painful, a washout to $2,100 would likely create a generational buying opportunity, resetting leverage and sentiment for the next cycle. However, trying to catch the falling knife now is exceptionally risky. Prudent strategy: wait for volatility to compress and for the on-chain NUPL to show true capitulation (potential move into “Capitulation” or “Hope” zone) before deploying significant capital.