
Trader Gert van Lagen has sparked discussions within the trading community with his analysis, proposing that Bitcoin (BTC) could surge to $200,000 sooner than expected.
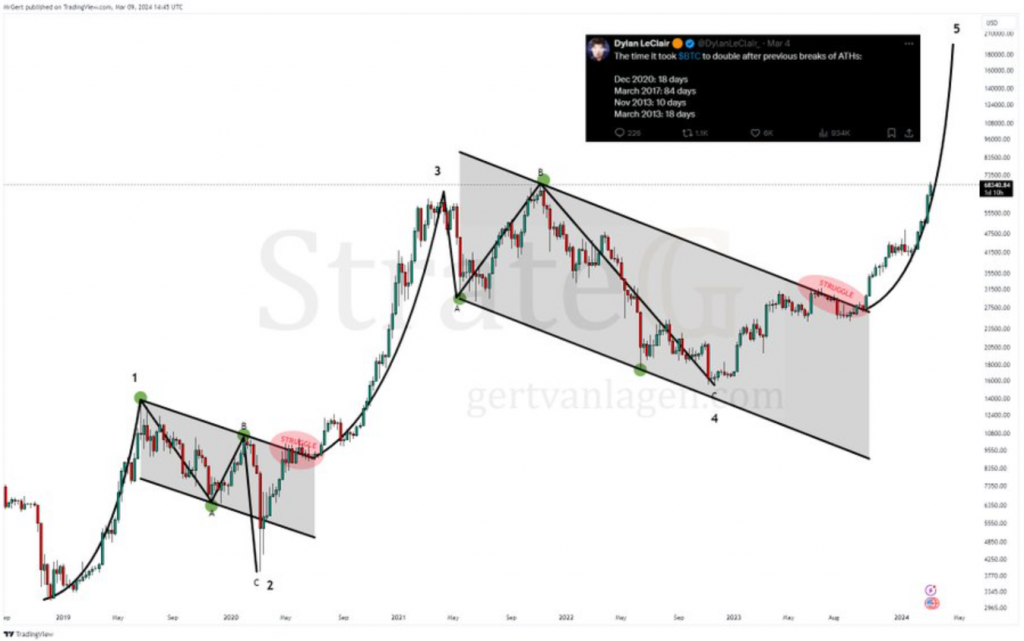
Analyzing the provided Bitcoin chart reveals a noteworthy trend: After reaching an all-time high (ATH), Bitcoin has historically doubled in price within varying timeframes, ranging from as little as 10 days to as much as 84 days.
The current trajectory of the Bitcoin market on the chart displays a robust bullish pattern, emerging from a consolidation phase known as the “struggle” period. This phase, characterized by a tightening range of price highs and lows, typically precedes a significant breakout.
Van Lagen’s analysis points out that Bitcoin’s recent ATH is a significant development. Historically, such milestones have been followed by strong bull runs, as illustrated in the chart. The structured market recovery post-“struggle” phase reinforces the trader’s belief that a move towards $200,000 before the next Bitcoin halving is increasingly plausible.
Looking closely at the current Bitcoin chart, the $41,000 support level remains solid, having been tested and upheld multiple times, indicating a stable foundation for the cryptocurrency’s valuation. In terms of resistance, Bitcoin is challenging upper limits, with the psychological barrier of $100,000 representing the next notable milestone. A breakthrough above this level could potentially trigger a parabolic surge, supported by historical price action following ATH breakouts.
Given the historical doubling pattern post-ATH, the case for a $200,000 price target for Bitcoin becomes compelling under current circumstances. However, this scenario depends on various factors, including sustained institutional adoption and positive regulatory developments.