
The Tug-of-War: Can a Technical Bitcoin Breakout Overcome Massive ETF Outflows?
Bitcoin is at a familiar crossroads, caught between a compelling technical setup and a stark fundamental headwind. While the charts paint a picture of a brewing Bitcoin breakout from a multi-week symmetrical triangle, the on-ground reality shows institutional capital fleeing. Spot Bitcoin ETFs have bled a staggering $780 million in net outflows in just five days, continuing a brutal monthly trend. This clash between bullish pattern and bearish flows defines the current high-stakes battle for $90,000.
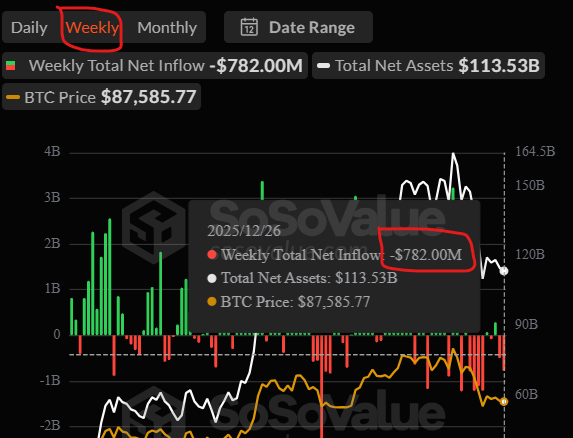
The Bearish Anchor: Relentless Institutional ETF Outflows
The data is unambiguous and concerning. The 12 U.S. spot Bitcoin ETFs have now seen over $1 billion exit in December alone, part of a larger $3.48 billion exodus since November. This signals a clear cooling of institutional conviction following October’s all-time high, removing a key pillar of buy-side support that fueled the last rally. This outflow trend aligns with tempered market expectations for near-term Federal Reserve rate cuts, creating a macro headwind.
The Bullish Catalysts: Geopolitics & Leveraged Speculation
Yet, price has held remarkably resilient. Two counter-forces are at play. First, renewed geopolitical tension between Russia and Ukraine has triggered a flight to perceived safe-haven assets, with Bitcoin catching a bid alongside oil and gold.
Second, derivative traders are piling into leveraged long positions. The Bitcoin weighted funding rate has spiked to October highs, and open interest is up 7% in 24 hours. This indicates aggressive betting by short-term speculators on an imminent upside move, creating a self-reinforcing cycle of buying pressure.
Technical Setup: The Symmetrical Triangle Breakout Watch
The 4-hour chart reveals the source of trader optimism: a textbook symmetrical triangle formed since mid-November. This is a classic consolidation pattern that typically resolves in a powerful directional move.
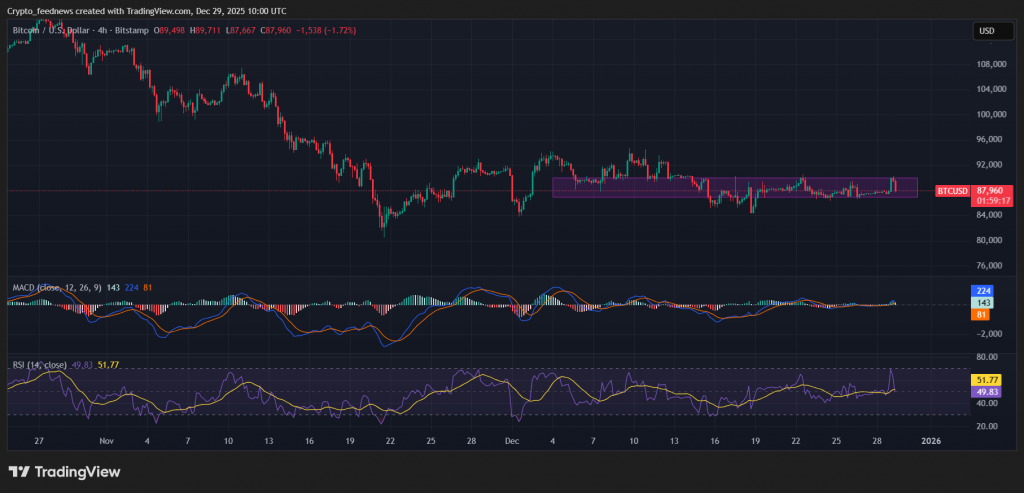
Momentum indicators are turning green. The Aroon Up line hits 100%, showing strong bullish trend strength, and the MACD has crossed into positive territory. The key level to watch is $90,975 (the 38.2% Fibonacci level). A decisive, high-volume break above this resistance confirms the Bitcoin breakout and targets a move toward $94,200.
The Line in the Sand: However, the bullish thesis is invalidated by a drop below $87,000, which would open a path back to $85,000.
My Thoughts
This is a battle between slow institutional money (leaving via ETFs) and fast speculative money (entering via futures). While the ETF flow is a serious fundamental red flag, the technical compression and geopolitical bid cannot be ignored. I believe the technicals will win in the short term. The symmetrical triangle is too clean, and the leveraged crowd is too positioned for a squeeze. A Bitcoin breakout above $90,975 could trigger a violent move to $94K+ as shorts cover. However, view this as a tactical trade, not a long-term investment signal, until ETF flows turn positive again.