
Institutional demand for Bitcoin shows no signs of slowing. Spot Bitcoin ETF inflows recorded $180.4 million on March 13, marking another day of positive flows after a volatile start to the month . The funds have now strung together multiple sessions of inflows, reinforcing the narrative that institutional allocators view current levels as an accumulation zone rather than an exit .
BlackRock’s IBIT Leads the Charge
The largest share of Thursday’s inflows went to BlackRock’s IBIT, which added $143.6 million . Fidelity’s FBTC followed with $23.2 million, while VanEck’s HODL contributed $8.1 million. Smaller inflows were recorded for Bitwise’s BITB ($3.1 million) and ARK Invest’s ARKB ($2.4 million) .
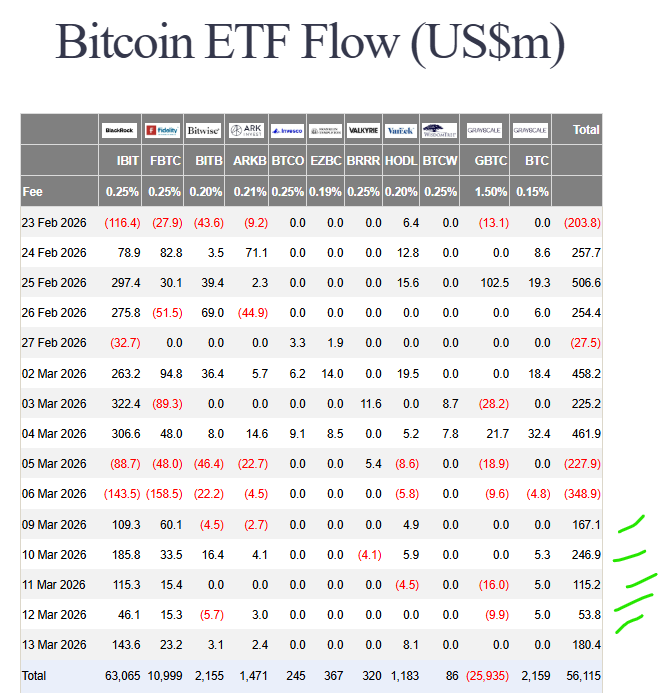
Several products, including Grayscale’s GBTC, Invesco’s BTCO, and Franklin Templeton’s EZBC, reported zero daily flows. This concentration of inflows in the largest issuers suggests that institutional liquidity continues to consolidate around the most established ETF providers .
The Bigger Picture: A Streak of Strength
Thursday’s inflows extend a positive trend that began after March 6, when funds collectively bled $348.9 million . Since then, the trajectory has reversed sharply:
- March 9: +$167.1 million
- March 10: +$246.9 million
- March 12: +$53.8 million
- March 13: +$180.4 million
This three-week trend of positive flows suggests that institutional capital is returning in force, with March now shaping up as a recovery month after February’s outflows .
Analysts Turn Bullish on Technical Structure
With ETF flows providing a solid foundation, analysts are now focusing on Bitcoin’s technical setup. Ali Martinez noted that Bitcoin has entered a “low-resistance zone,” with little standing in the way until $82,045. He identified key support at $66,898 .
Fellow analyst Michaël van de Poppe highlighted a higher-low structure forming near $65,117, with resistance bands between $76,604 and $79,127 and a broader upside target near $80,646 . He described the recent price action as “classic Friday volatility” and expects fresh highs within the next two weeks .
Other analysts point to the $73,726 level as a critical on-chain resistance. According to the MVRV pricing model, a sustained close above this level could open the path toward $95,894 .
My Thoughts
The Bitcoin ETF inflows story has shifted from “are they back?” to “how long can this last?” March 13’s $180.4 million adds to a streak that now totals over $648 million in four sessions. This is not a one-off spike—it’s sustained accumulation.
What’s particularly notable is the breadth of participation. While IBIT dominates, FBTC, BITB, and HODL are all seeing consistent flows. This suggests that institutional capital is diversifying across issuers rather than crowding into a single product.
The technical alignment with analyst targets is compelling. Martinez’s $82,045 target aligns with the upper end of van de Poppe’s range and the psychological level just above Bitcoin’s March 4 high. If ETF inflows continue at this pace, that level could be tested sooner rather than later.
For traders, the path is clear: watch ETF flow data daily. As long as inflows remain positive, the path of least resistance is upward. A reversal in flows would signal that institutional conviction is wavering, but for now, the trend is your friend.