
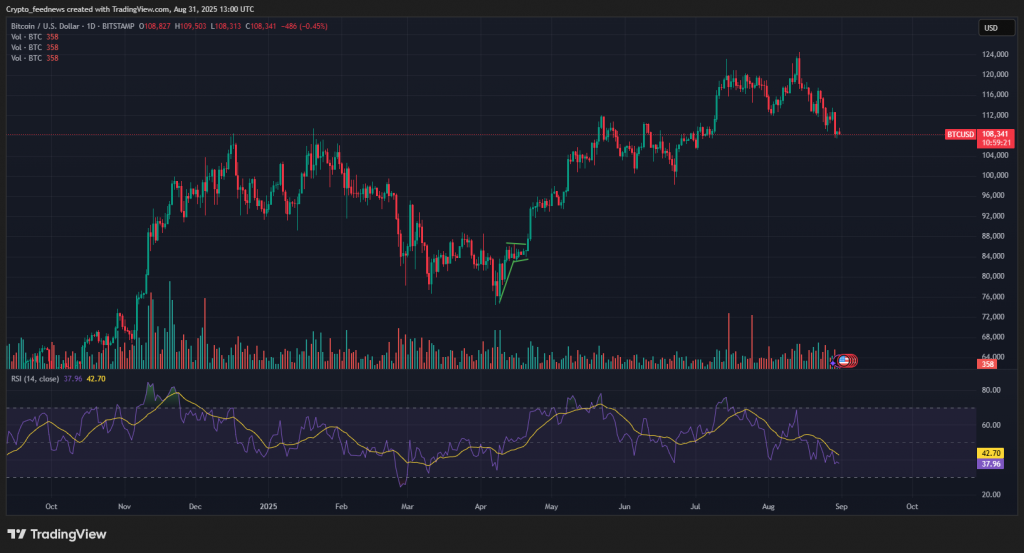
Bitcoin’s price action has been muted, trading flat around $108,700. However, beneath the surface, key on-chain metrics are telling a different story. Data suggests that short-term speculators are capitulating, a classic sign that often precedes a significant market rebound. Here’s a breakdown of the signals that point to a potential bottom.

Signal #1: Short-Term Holders Are Capitulating
The Spent Output Profit Ratio (SOPR) for short-term holders has plummeted to 0.982, its lowest level in months. This metric reveals that a large number of recent sellers are offloading their BTC at a loss.
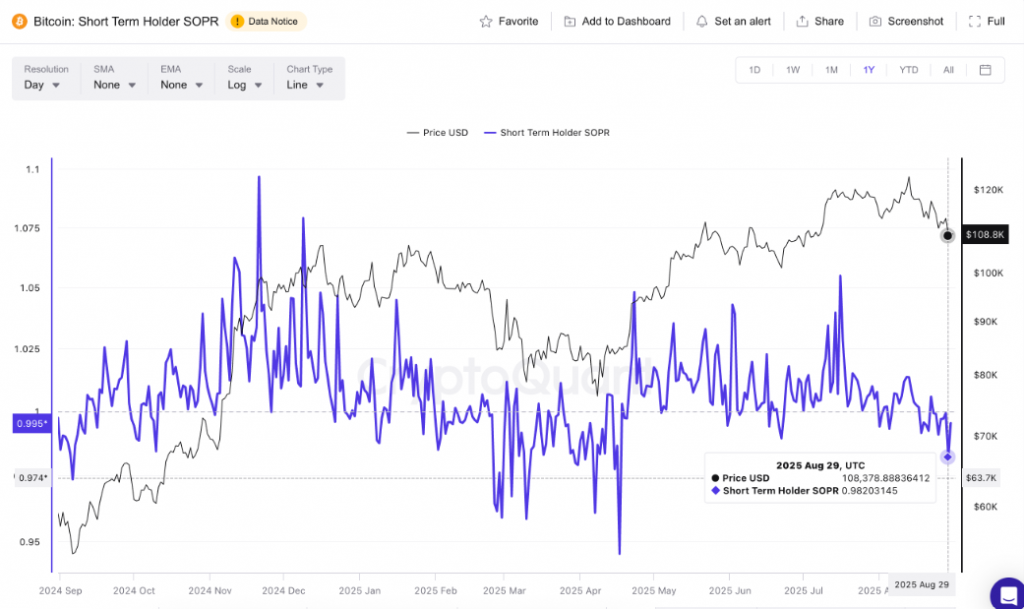
Why is this bullish? This behavior, known as “weak hands exiting,” historically clears the market of panic-driven sellers. It creates a stronger foundation for a rebound, as coins are transferred from impatient traders to confident long-term holders.
A similar SOPR low occurred on April 17, when Bitcoin bottomed at $84,800 before rocketing 31.6% to $111,600.
Signal #2: Strong Support at $108,000
The UTXO Realized Price Distribution (URPD) map shows where large amounts of Bitcoin were originally purchased, creating natural support and resistance levels.
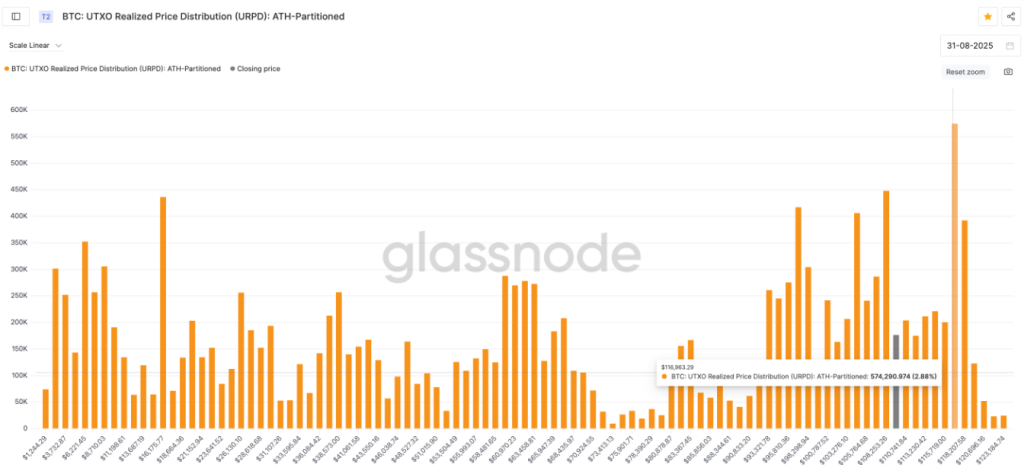
- Strong Support: A massive cluster of 447,544 BTC (2.25% of supply) was acquired around $108,200. Another cluster of 286,255 BTC sits at $107,000.
- Stiff Resistance: Significant supply barriers exist at $113,200 and $114,400. The heaviest resistance wall is at $116,900, where 2.88% of all BTC last moved.
This data explains why the price has found steady support in the $108,000 zone despite selling pressure.
Bitcoin Price Prediction: Key Levels to Watch
The combination of these on-chain signals paints a clear picture for traders.
Bullish Scenario:
For a rebound to begin, bulls must reclaim $109,700. A break above the key $113,500 resistance (a repeated rejection zone) would be a major sign of strength and could open the path toward $117,400.
Bearish Scenario:
The entire bullish thesis would be invalidated if Bitcoin experiences a daily close below $107,300. This would likely trigger a deeper correction.
The Bottom Line
While the price chart looks uncertain, the on-chain story is optimistic. The market is showing classic signs of shaking out weak hands and building a base of strong support. For investors, this could be the calm before the storm—a potential accumulation zone before the next leg up. Keep a close watch on the $107,300 support and the $113,500 resistance; these levels will dictate the next major move.