
Bitcoin Price Analysis: Rally Tests $95K as Risk-Adjusted Returns Diverge
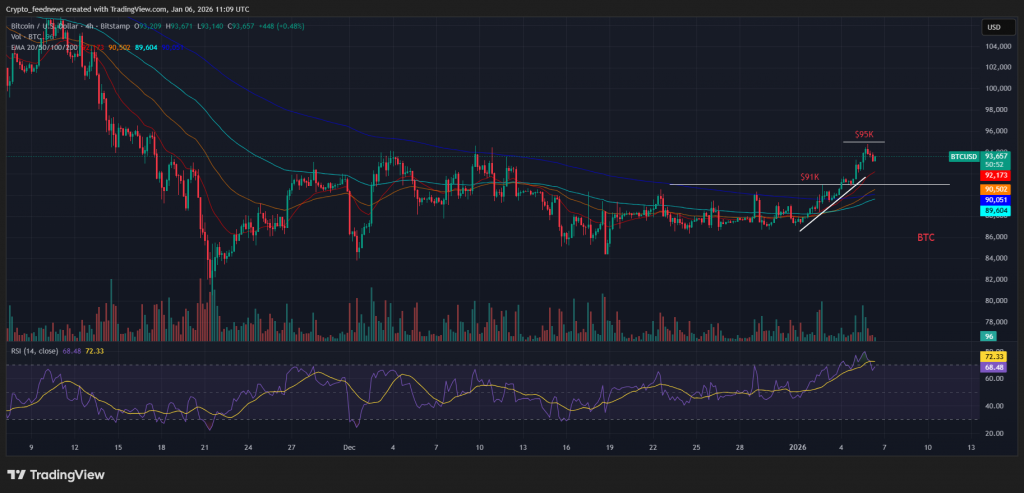
Bitcoin continues its ascent, pushing toward the $95,000 resistance level with a 1.4% gain in the last 24 hours. However, our latest Bitcoin price analysis reveals a concerning divergence beneath the surface: while price climbs, Bitcoin’s risk-adjusted returns, as measured by the Sharpe ratio, are weakening. This suggests the current rally is being driven more by positioning and short-term flows than by sustained, efficient demand.
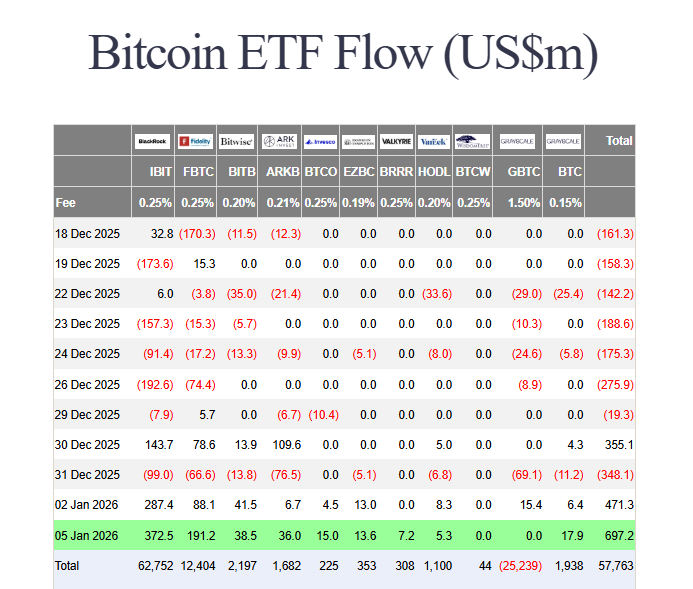
Supporting the price move, trading activity is undeniably picking up. Spot volume rose 34% to over $50 billion, and derivatives volume jumped 43%. Critically, ETF inflows are providing massive tailwinds. On January 5th alone, spot Bitcoin ETFs attracted a staggering $697.25 million, bringing the first-week total for 2026 to over $1.16 billion. BlackRock’s IBIT led with $372.5M, showing institutions are still accumulating.
Technical and On-Chain Signals in Our Bitcoin Price Analysis
From a technical standpoint, BTC has reclaimed its 10 and 50-day moving averages, a short-term bullish sign. However, it still faces major resistance between the 100 and 200-day averages ($96K-$106K). Momentum indicators like the Stochastic RSI are near overbought levels, suggesting the rally may be stretched.
On-chain data according to CryptoQuant echoes the caution. Market cycle indicators point to a cooling phase with slowing upside momentum, not outright capitulation. Analysts note that volatility is rising without a corresponding improvement in returns—a pattern typical of consolidation or direction-seeking markets, not strong trend reversals.
My Thoughts
This is a classic “messy middle” phase. The ETF inflows are undeniably bullish and creating a solid demand floor. However, the poor risk efficiency indicates this isn’t the explosive, FOMO-driven phase of a bull market. It looks more like large-scale re-accumulation. For the rally to sustainably break above $95K and target $100K, we need to see the Sharpe ratio stabilize and improve, signaling that returns are keeping pace with rising volatility. Until then, expect choppy price action between $90K and $96K.