
Bitcoin price hovers near $112,700. Buyers and sellers test each other at this level. The next move depends on whether demand returns or sellers push harder.

The Current Battle for Bitcoin price
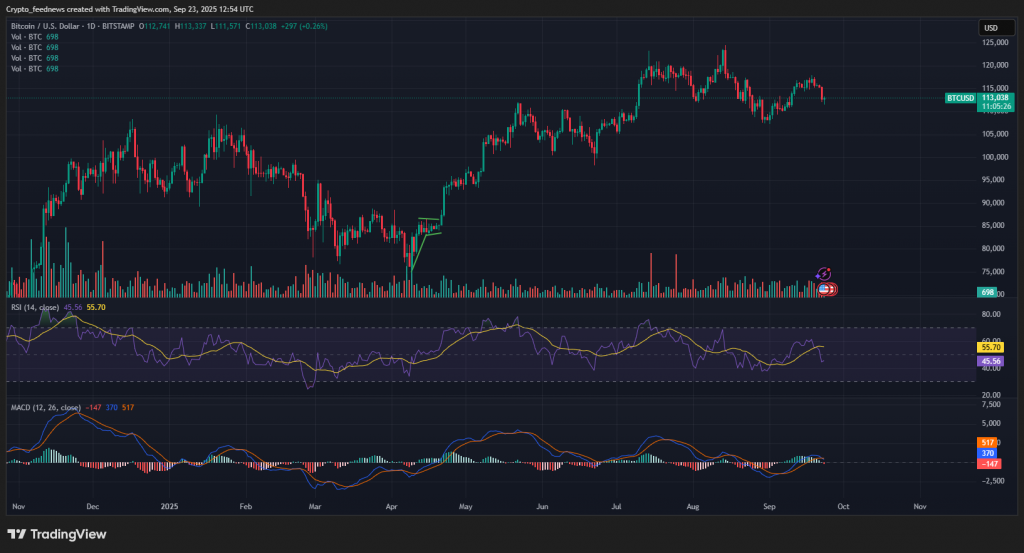
Right now, Bitcoin price is caught in a tight range between support at $112,000 and resistance at $115,000. The recent price action has been fragile, with large liquidations below $113,000 reminding everyone of the market’s volatility.
The main story remains institutional flows through spot ETFs. However, these flows have become inconsistent. We’re seeing a clear tug-of-war between long-term institutional accumulation and short-term profit-taking, which is creating this consolidation phase.
The Bullish Case – A Path to $122,000
A daily close above $115,000 would open room toward $118,000 and later $122,000. Two catalysts would help
- Daily net inflows return to spot Bitcoin ETFs.
- Macro data show lower inflation or a dovish Fed.
- If both appear, Bitcoin would shift to a higher range
The Bearish Risks – A Slide Toward $105,000
Loss of $112,000 would send price to $108,000. A second break risks long positions and targets $105,000.
- Weak signals line up
- RSI but also MACD drift lower.
- September records net losses for crypto.
- wallets send coins to exchanges hinting at more selling.
Final Outlook and Key Levels to Watch
In summary, the short-term Bitcoin price prediction hinges on the $112,000 – $115,000 range.
- Bullish Signal: A sustained break above $115,000 with high volume targets $122,000.
- Bearish Signal: A breakdown below $112,000 opens the door for a test of $108,000 and possibly $105,000.
Traders should keep a close eye on ETF flow data and derivatives market activity for the next clear directional cue.