
Bitcoin is attempting its first Bitcoin Bollinger Bands breakout in months. However, the reaction among traders is mixed.
Even the indicator’s creator, John Bollinger, just revealed a fresh BTC position. He appears more bullish than some market participants.
Bitcoin Bollinger Bands breakout faces stiff resistance
According to TradingView data, BTC/USD saw its second daily close above the upper Bollinger Band on Wednesday. The last time this happened was mid-January.
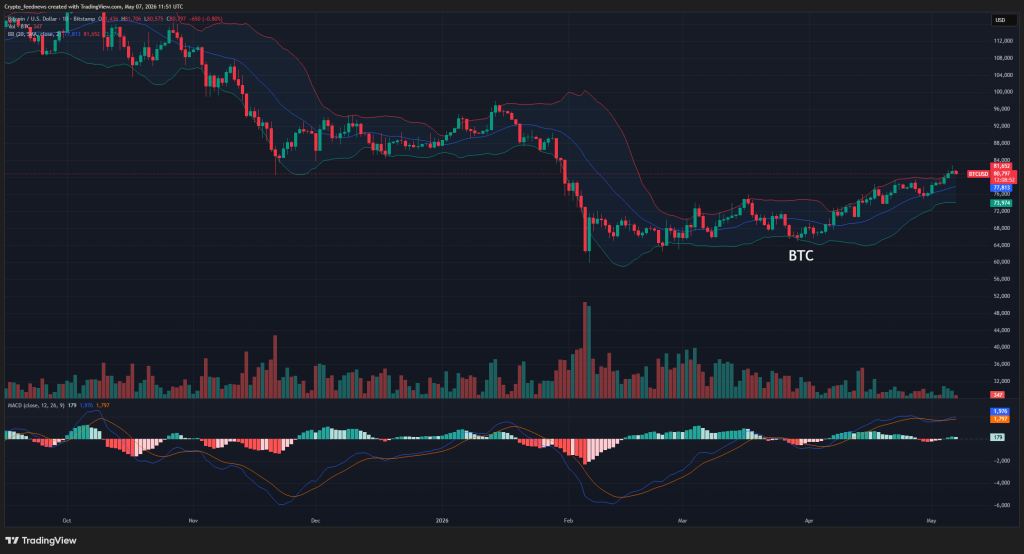
The Bollinger Bands indicator helps traders assess both volatility and momentum. Recently, the gap between its trend lines reached the narrowest level ever recorded for Bitcoin.
As a result, many predicted a breakout move. Still, the direction remained debatable. Everyone expected heightened volatility to follow.
Mixed responses as price hits resistance
Commenting on the current price action, a trader known as SuperBro pointed out challenges. The price is now in an area full of potential rejection points.
“Closed above the upper Bollinger Band, above the trendline on closing prices, but just below the log trendline on wicks,” SuperBro wrote on X.
He added that most potential liquidations now belong to long positions below the price. Shorts have already been taken out.
“There are relatively few short liquidations remaining up to 85K compared to long liquidations down to 74K,” he continued. “However, bulls still have the momentum advantage, and I don’t yet see a good reversal setup. Despite the liquidation imbalance, I’m holding tight to see if we can blast through.”
John Bollinger turns positive on Bitcoin
Meanwhile, John Bollinger shared his own update. One of his investment fund’s proprietary trading models has flipped “positive” on Bitcoin. Consequently, the fund has taken a position accordingly.
Bitcoin Bollinger Bands breakout also shows “overheated” signal
Wednesday brought another Bollinger Band milestone. This time, it relates to the MVRV ratio for speculative investors.
The MVRV ratio compares Bitcoin’s market cap to its realized cap (the price at which the supply last moved). A Bollinger Bands derivative of this metric entered “overheated” territory for the first time since late 2024.
The X analytics account Frank Fetter pointed this out. The last time this happened, BTC/USD was building its first visit to $100,000.
When asked if “overheated” conditions imply a price reversal, the account said “not necessarily.” A reversal is not a guaranteed outcome.