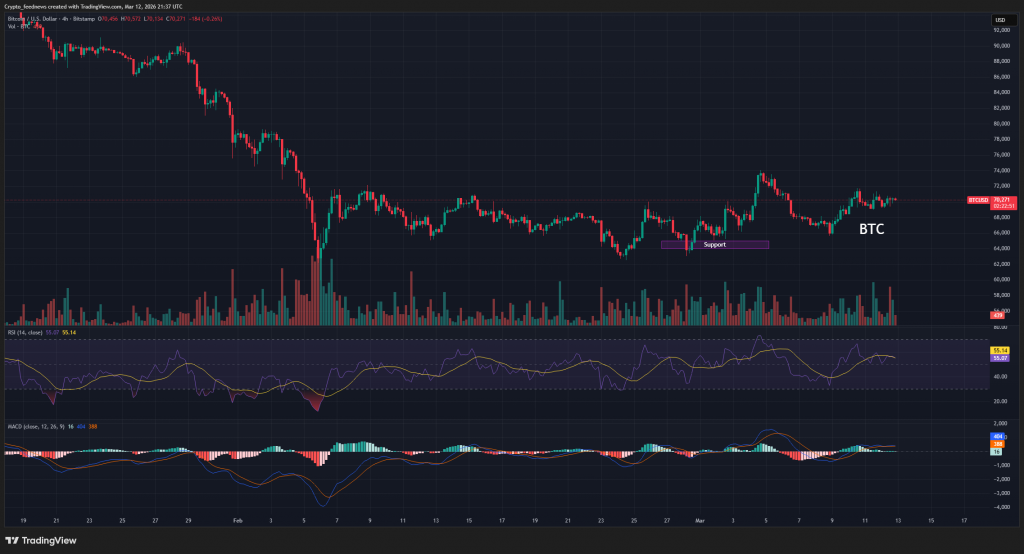
Bitcoin is once again knocking on the door of its range high—and getting rejected. The $72,000 resistance level has repeatedly capped upside momentum on the daily timeframe, and the latest attempt is showing early signs of failure. A developing rejection wick suggests bullish momentum is fading, raising the probability of a rotation back toward lower support levels. This Bitcoin price analysis examines the technical setup and what comes next.
Bitcoin Price Analysis: The $72K Resistance Story
The current market structure is defined by a clear range between approximately $50,000 on the downside and $72,000 on the upside . For weeks, Bitcoin has oscillated within these boundaries, with the upper region acting as a magnet for sellers. Each test of $72,000 has been met with aggressive selling pressure, and this week’s move appears to be following the same script.
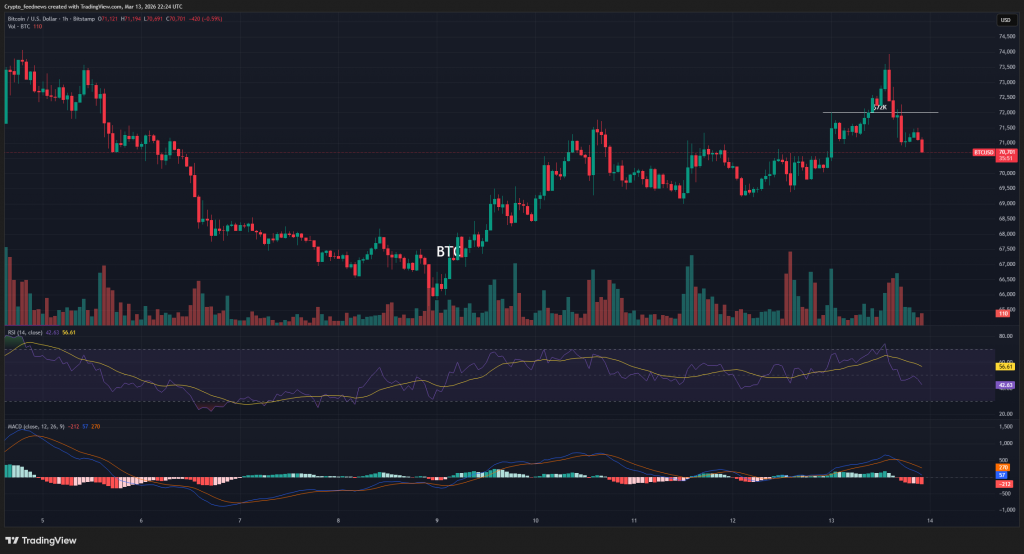
The appearance of a rejection wick on the daily candle is a critical technical signal. It indicates that buyers pushed price into the resistance zone but failed to sustain momentum, forcing the market back lower as selling pressure intensified . This behavior highlights the importance of the value area high as a pivot point between bullish continuation and bearish rotation.
The Range-Bound Reality
Range-bound environments are characterized by price oscillating between key levels as liquidity is redistributed across the market. In Bitcoin’s case, this structure remains firmly intact. As long as the $72,000 resistance holds, the probability favors further rotational price action rather than a sustained breakout .
If bearish confirmation occurs through a close below the value area high, the next logical downside target becomes the swing low within the range. This would place the $50,000 support region back into focus—a historically significant zone where strong demand previously emerged .
Market Structure Implications
When an asset repeatedly fails to break above resistance, it often signals that the market requires additional liquidity before attempting another breakout. This liquidity is typically found at lower levels where stop orders and resting bids accumulate . Because of this dynamic, rotational movements between range highs and lows are common in consolidation phases.
A confirmed rejection below the value area high would increase the probability of a move toward $50,000, while a decisive breakout above $72,000 would be required to invalidate the bearish outlook .
My Thoughts
This Bitcoin price analysis points to a market that is structurally indecisive. The repeated rejection at $72,000 suggests that sellers have genuine conviction at these levels, while the absence of a breakdown indicates buyers are still willing to defend the range.
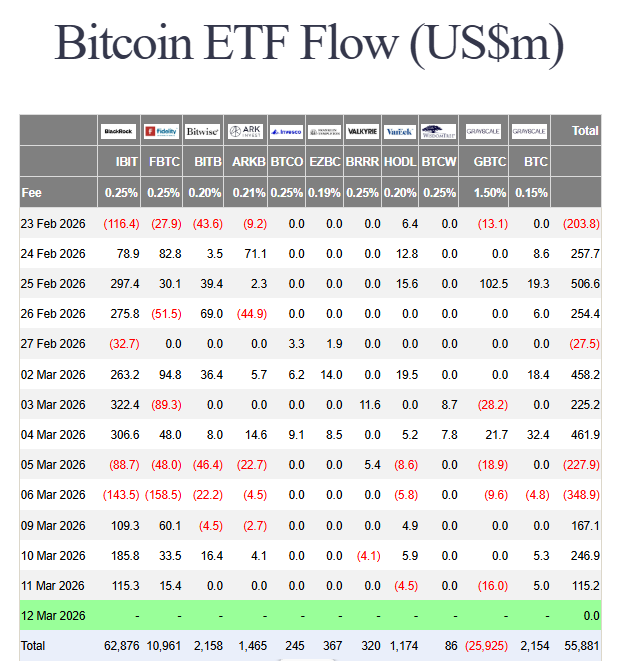
The $50,000 support is the line in the sand. A test of that level would likely attract serious institutional interest, given the ETF inflows and corporate accumulation we’ve seen throughout March . If that support holds, the range remains intact and we await the next breakout attempt. If it fails, the structural damage would be significant.
For traders, this is a range-bound environment that rewards patience. Wait for confirmation—either a clean breakout above $72K with volume, or a decisive breakdown below the value area high signaling a move toward $50K. Until then, chop is the name of the game.