
Ethereum is at a crossroads. After Monday’s rally stalled just above $2,000, all eyes are now on the critical Ethereum price support zone at $1,800. This level isn’t just another number on the chart—it represents the lower trend line of a symmetrical triangle pattern that has been forming for months. If this support fails, the technical implications point toward a drop below $1,500 .
Why the Ethereum Price Support at $1,800 Matters So Much
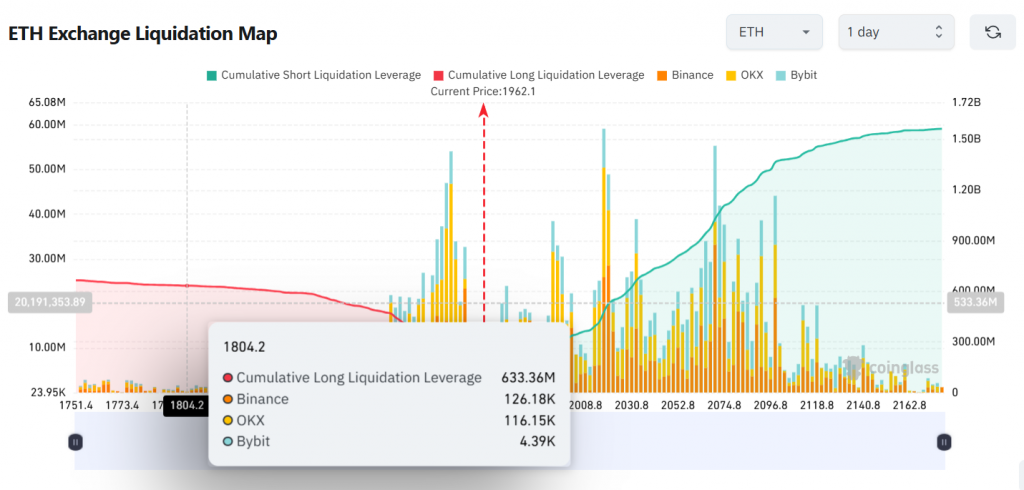
On-chain data reveals why this zone is so significant. Approximately 1.23 million ETH were acquired at an average price of $1,890 over the last 30 days, creating a dense cluster of cost basis that acts as natural support . Below spot price, $624 million in cumulative long liquidation exposure sits just under $1,800, forming a liquidity pocket that could either catch falling knives or accelerate a breakdown if triggered .
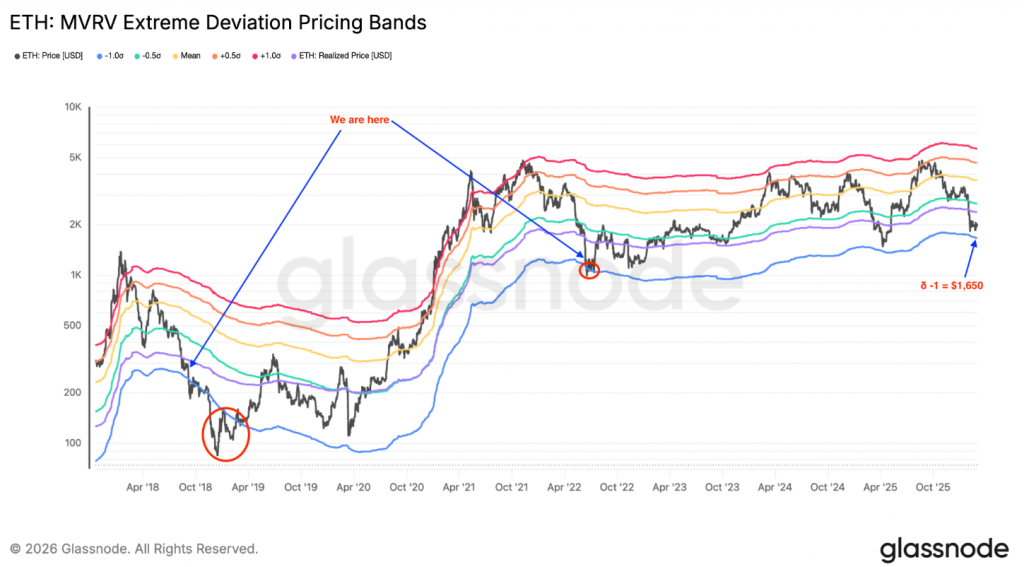
The MVRV extreme deviation pricing bands suggest Ethereum still has room to drop before reaching historically oversold levels. The next band sits around $1,650, but past bear markets have consistently bottomed below the lowest MVRV band—as seen in 2018 and 2022 . If history repeats, the ultimate bottom could fall below $1,650, aligning with the symmetrical triangle target.
The Bearish Technical Setup
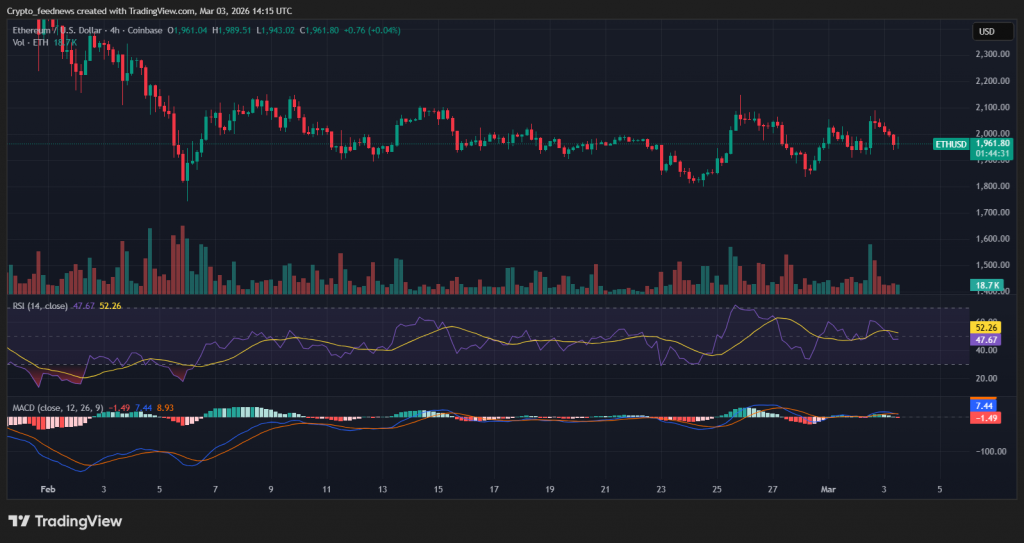
The symmetrical triangle pattern on the daily chart has been compressing price action for weeks. A decisive break below the lower boundary at $1,850 would likely trigger a test of the February multi-year low at $1,750 . Below that, the measured target of the triangle projects a move toward $1,400—a 28% decline from current levels.
CryptoQuant analyst Maartunn spotted 67,000 ETH worth approximately $130 million sitting just below spot price, reinforcing the significance of this support zone . Meanwhile, the Crypto Fear & Greed Index remains stuck in “extreme fear” territory at 16, indicating speculative capital is largely absent .
My Thoughts
The Ethereum price support narrative is binary. Hold $1,800, and the range-bound structure remains intact, allowing for a potential grind back toward $2,100–$2,300 . Lose it, and the path to $1,500 opens rapidly.
What’s interesting is the divergence between price action and on-chain behavior. Exchange reserves continue declining, with nearly 19,000 ETH leaving exchanges just last week . Staking has reached an all-time high of 37.1 million ETH—approximately 31% of circulating supply . Supply compression is happening, but it’s being overwhelmed by relentless selling pressure from ETFs and whales .
Tom Lee’s six on-chain indicators suggest a potential bottom in the $1,800–$2,000 range . However, with 563,600 ETH dumped by ETFs over five weeks and whales continuing distribution, calling a definitive bottom remains premature. The market needs to see this selling absorbed before any sustainable rally can begin. We should highlight also that Ethereum ETF have recorded a positive net inflow on March 02 with $38.7M led by Blackrock $26.5M .
For traders, $1,800 is the ultimate risk-management level. Position accordingly, and respect what the price tells you.