
Bitcoin experienced heightened volatility this week, facing resistance around the $69,000 to $70,000 mark. The daily chart suggests that sellers are actively preventing the price from breaching the psychological $70,000 level.
Despite this, the cryptocurrency saw a 1.34% intraday gain, offering potential breakout opportunities for buyers, hinting at a possible prolonged uptrend.
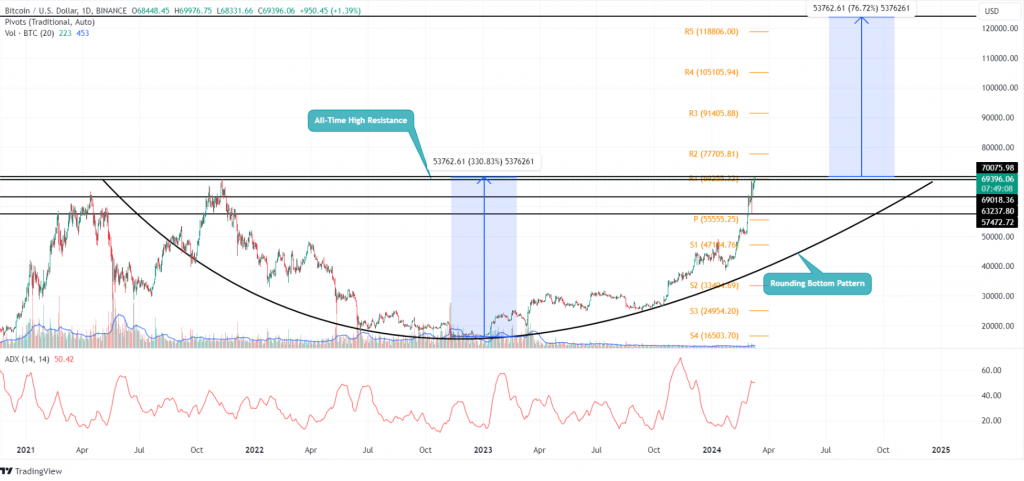
A closer look at the daily chart reveals a bullish pattern known as a “rounding bottom,” indicating a transition from a bearish to a bullish trend. This pattern is characterized by a gradual and rounded increase in price, resembling the shape of a “U.”
Currently priced at $69,371, Bitcoin appears poised for a bullish breakout from the pattern’s neckline resistance at the $69,000 to $70,000 range. A successful breakout above this level could signal further upward movement towards new highs.
If this pattern holds true, buyers could potentially drive the price to a theoretical target of $124,000. However, if the resistance at $70,000 triggers a correction, support levels at $63,240 and $57,500 may come into play, helping to maintain the bullish outlook. A potential pullback could even form a cup-and-handle pattern, further supporting the bullish sentiment.
Additionally, a tweet from crypto trader Ivan Tokenomija, shared by Santiment, highlights a notable trend in the Bitcoin market – a decrease in the balance of Bitcoin on exchanges. This decline suggests reduced selling pressure as investors move BTC to private wallets, typically for long-term holding. Such behavior is often seen as bullish, implying a potential price increase due to increased scarcity.
From a technical standpoint, as Bitcoin enters price discovery mode, buyers may encounter resistance levels at $77,635 and $91,400, aligned with the R2 and R3 of traditional pivot levels. The Average Directional Index (ADX) slope, currently at 50%, reflects an overextended rally, indicating a possible need for a minor pullback to regain bullish strength.