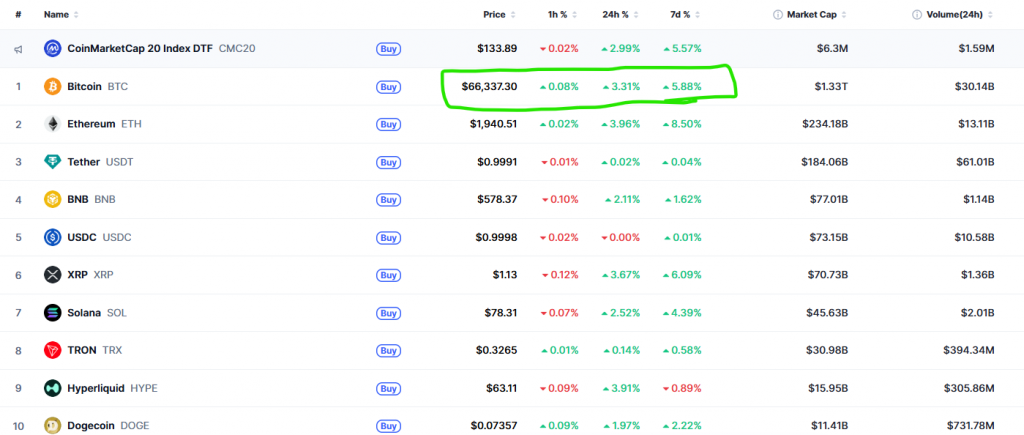
FED Bitcoin impact may be limited this cycle. All eyes are on the critical FOMC meeting today.
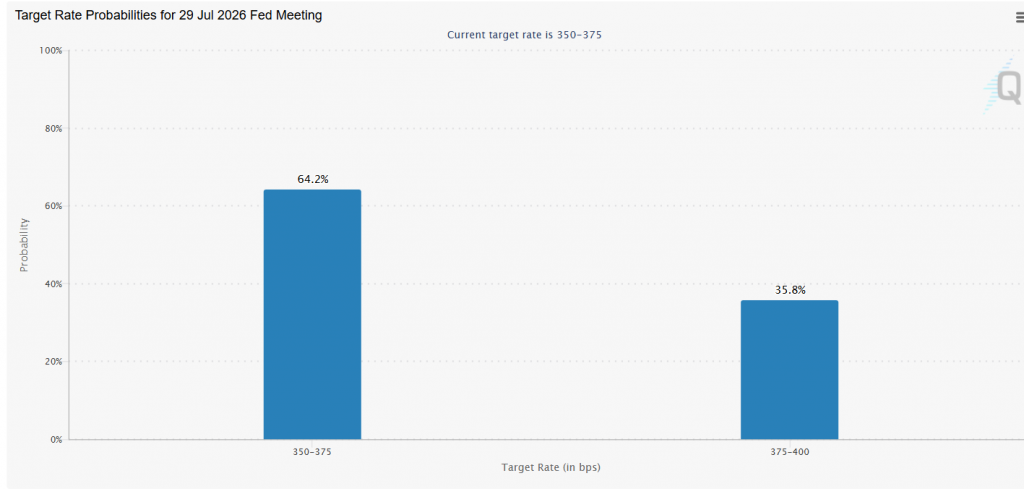
The market expects interest rates to remain unchanged. Nevertheless, a rate hike is not entirely ruled out.
Why FED Bitcoin impact matters now
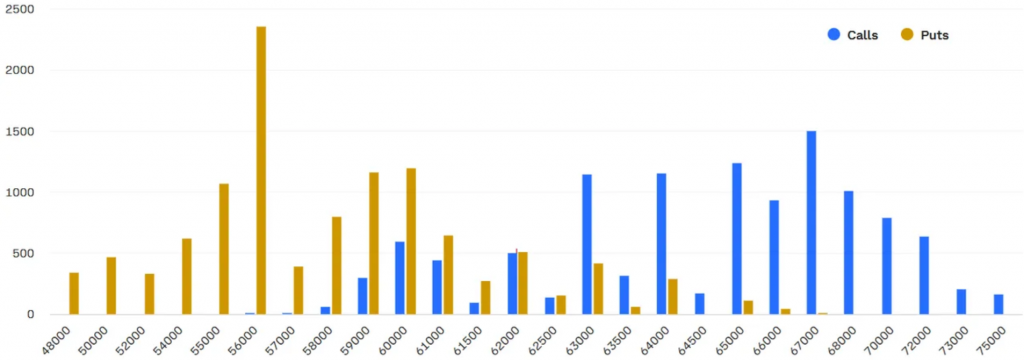
CME FedWatchTool shows a 33.7% probability of a 25 basis point hike. Expectations remain mixed ahead of the decision.
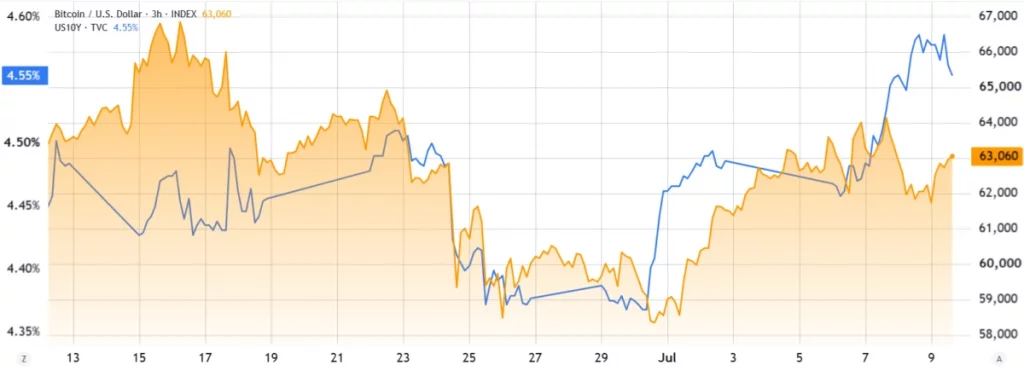
K33 Research suggests the impact may be less significant. This is compared to previous cycles. The correlation between Bitcoin and Nasdaq is near multi-year lows.
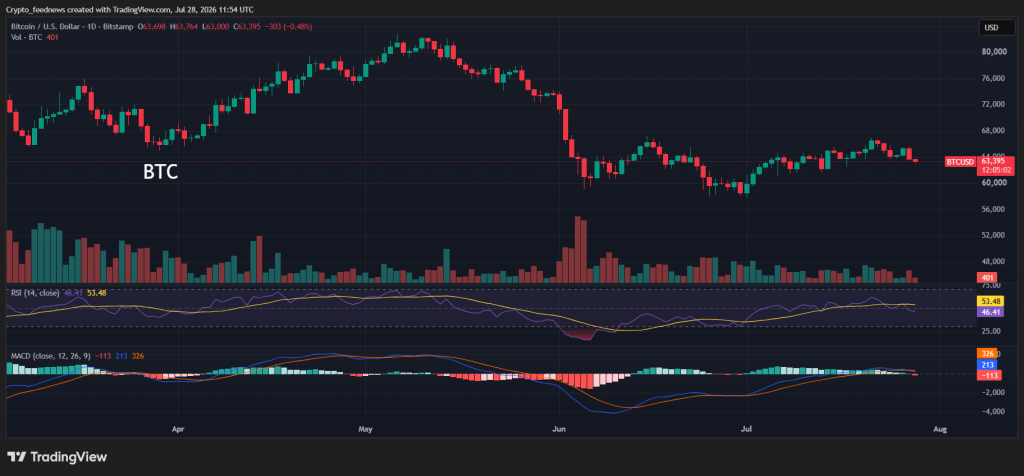
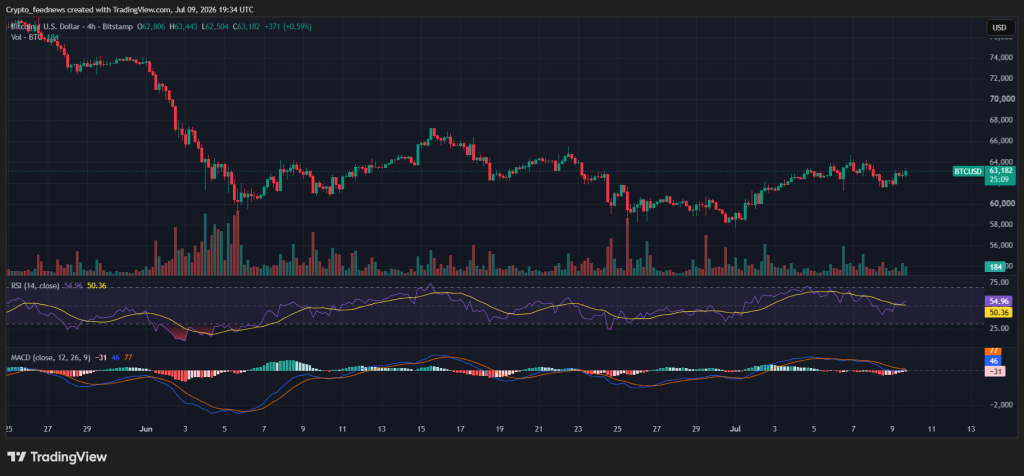
Head of Research Vetle Lunde explained the situation. The Nasdaq entered July with strong momentum. Bitcoin continued trading sideways with low volatility.
This has caused the correlation to approach its lowest levels. The two assets may increasingly diverge. Therefore, this FED decision may not be as decisive.
Bitcoin’s low volatility reduces reaction to macro developments. This could limit the impact on BTC and crypto markets.
Bitcoin’s rise may continue after FOMC meeting
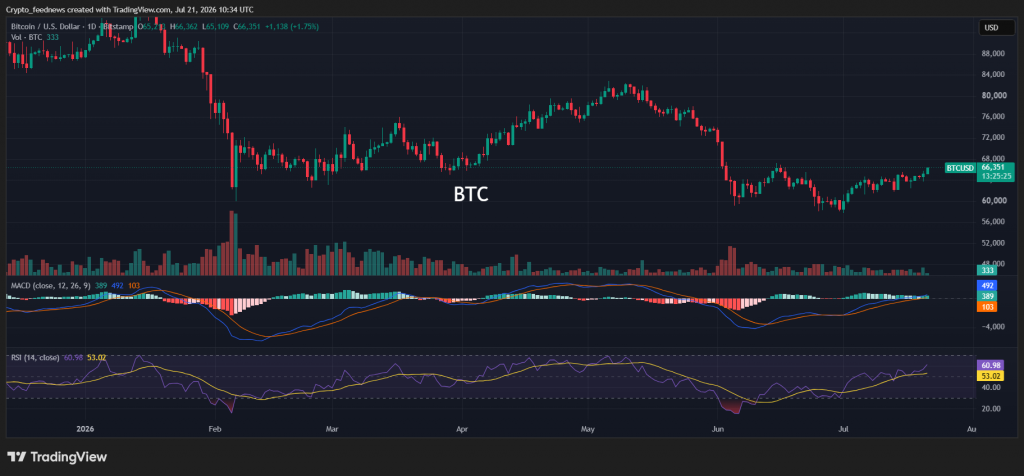
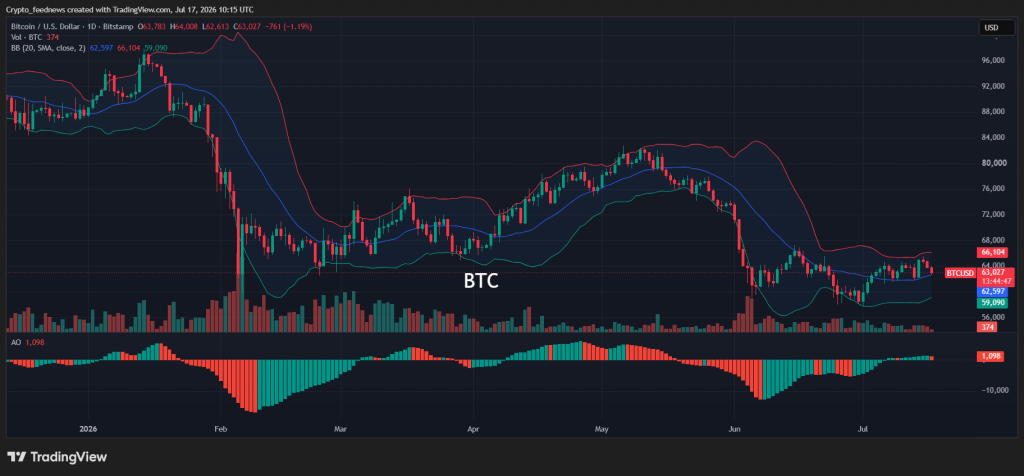
Analyst Michaël van de Poppe shares a similar view. He predicts Bitcoin’s rise will continue after the meeting.
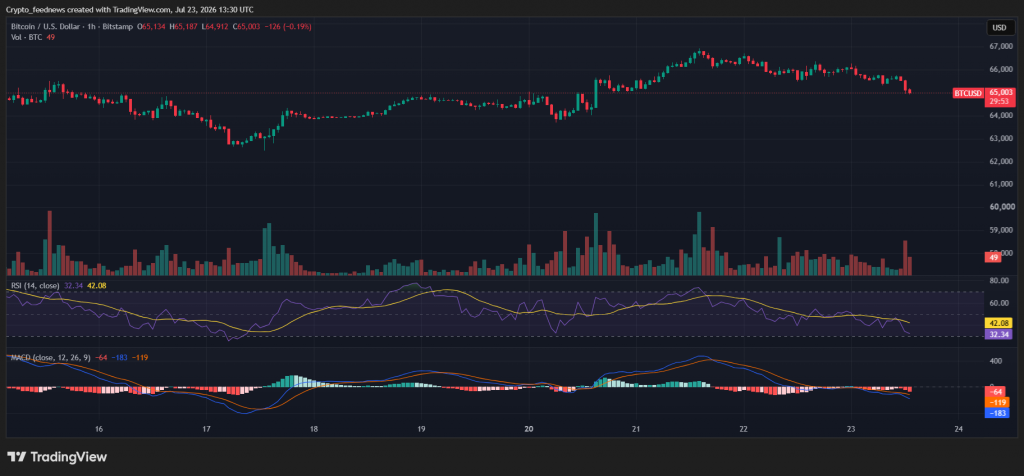
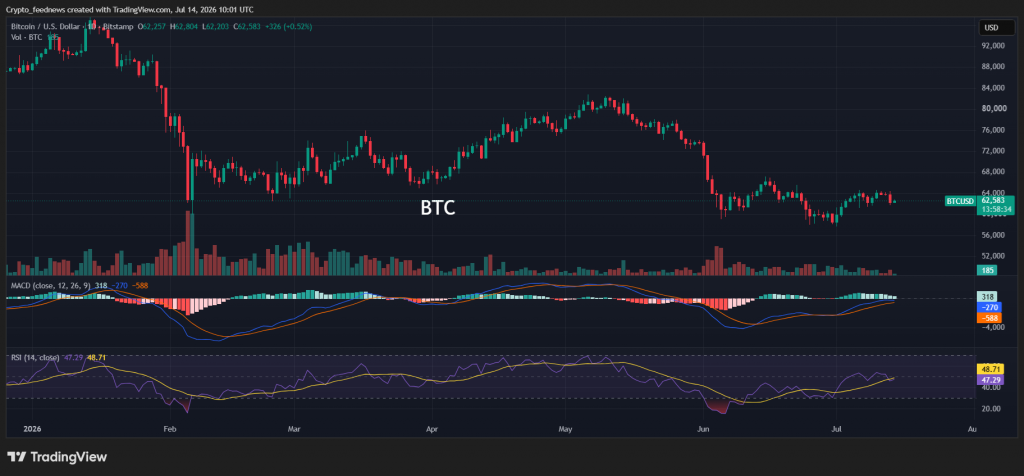
Bitcoin has shown a solid recovery recently. The upward movement is likely to continue.
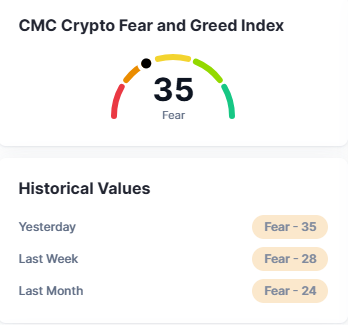
The market has priced in excessive fear ahead of the meeting. Bitcoin’s strong resilience supports this view. The rally will likely continue.