
After a turbulent start to September, Bitcoin is showing signs of stability. The price is holding above $115,000, and key indicators are now pointing towards a potential accumulation phase, suggesting reduced sell pressure.

Current Market Snapshot
As of now, Bitcoin is trading at $115,954, down a modest 0.5% over the last 24 hours. While it’s still 6.6% below its August all-time high of $124,128, it has gained 3.4% over the past week.
Critically, daily trading volume has surged 46.7% to $45.1 billion. This indicates a significant return of market activity. Derivatives volume also jumped over 42%, though a slight dip in open interest suggests some traders remain cautious about new positions.
Key Indicator: Sell-Side Risk Drops
A major signal comes from analyst Ali Martinez. On September 16, he noted that Bitcoin’s Sell-Side Risk Ratio dropped below 0.1%. Historically, this level is associated with local market bottoms, reduced selling pressure, and the start of accumulation phases.
He also identified $116,963 as a crucial supply wall. This is a key level where sellers might look to take profits if the price continues to climb.
The Scarcity Index Spikes
Adding to the bullish thesis, the Bitcoin Scarcity Index on Binance has spiked for the first time since June. This index rises when exchange supply thins out, often due to large investor withdrawals or a drop in sell orders. The last time this happened, Bitcoin’s price rallied to $124,000.
However, analysts caution that if this spike fades quickly, it could just be speculative noise. A prolonged period of high scarcity would be needed to confirm a strong, sustained accumulation phase.
Technical Analysis: Bulls vs. Bears
On the daily chart, Bitcoin is consolidating just below a major resistance level at $117,525.
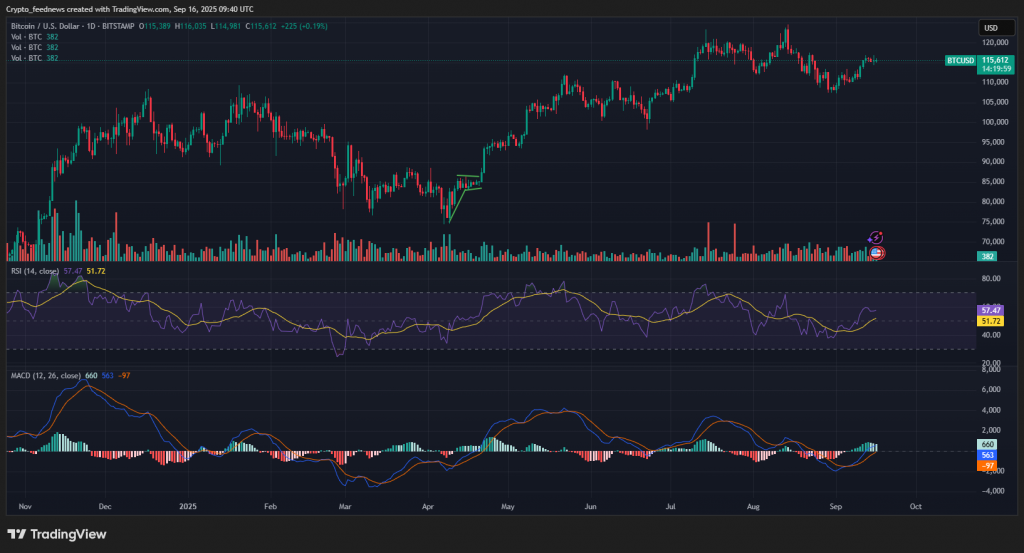
- Bullish Signals: The Momentum and MACD indicators are flashing buy signals. More importantly, BTC is trading firmly above its 50-, 100-, and 200-day moving averages, which all signal “buy.” This shows strong underlying strength.
- Bearish Signals: The Relative Strength Index (RSI) is neutral at 58, but other indicators point to overbought conditions, hinting at the possibility of a short-term pullback.
What’s Next for Bitcoin Price?
The path forward is clear. A decisive break above the $117,525 resistance could open the door for a retest of the $124,128 all-time high.
However, if Bitcoin fails to break through, we could see a retracement toward support levels at $112,244 or even $106,963. For now, the easing sell pressure provides a hopeful sign for bulls.