
Bitcoin new ATH within a year has a roughly 77% chance of happening. That is if historical price patterns repeat.
Right now, Bitcoin sits 35% below its all‑time highs. But in the past, this same drawdown level sparked seven new record highs within 12 months.
Bitcoin holds above $80K after hot CPI data
On Tuesday, hotter‑than‑expected U.S. CPI data caused brief volatility. Nevertheless, Bitcoin price held firmly above the key $80,000 support.
According to TradingView, Bitcoin traded around $8,525 at press time on May 13. It rebounded from intraday lows near $80,400 after the inflation report.
The asset continues consolidating below the important $82,300 resistance zone. Over the past week, several breakout attempts have failed.
Why Bitcoin new ATH within a year looks likely
Traders believe the hot CPI print was already priced in. As a result, downside pressure across crypto remained limited.
Risk appetite stabilized. Investors shifted focus toward upcoming U.S. crypto regulation, especially the proposed CLARITY Act. Many see this as a major catalyst for institutional adoption.
On‑chain sentiment has also improved. CryptoQuant analysts noted that their proprietary market cycle signal flipped Bitcoin into early bull territory for the first time since March 2023. This suggests longer‑term momentum still favors the upside.
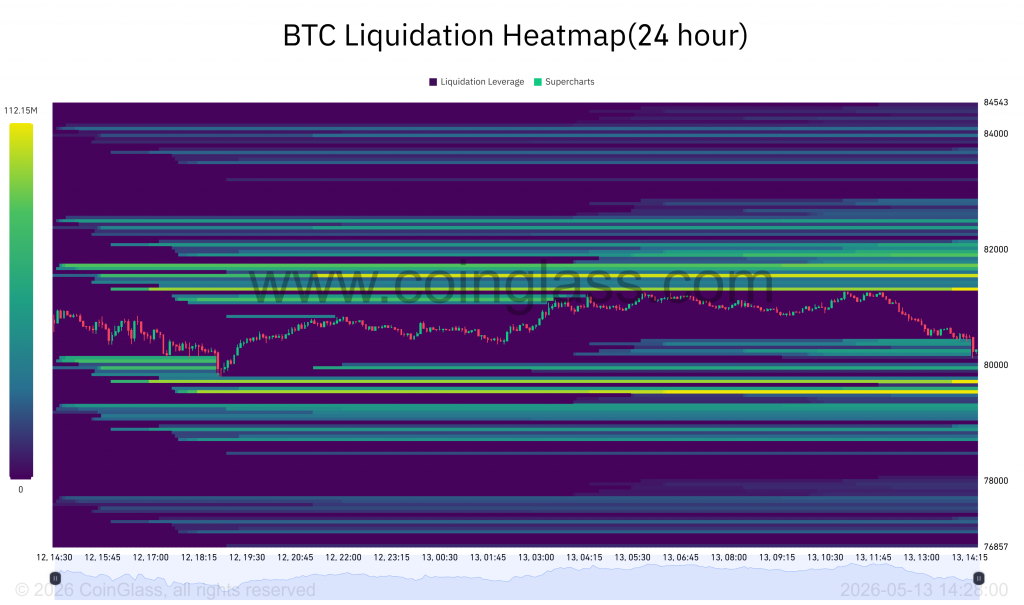
Derivatives positioning shows traders heavily defending the $80,000 region. CoinGlass data reveals large liquidation clusters between $84,000 and $85,500. Another dense liquidity pockets its just below $80,000.
Bitcoin price analysis: technical picture
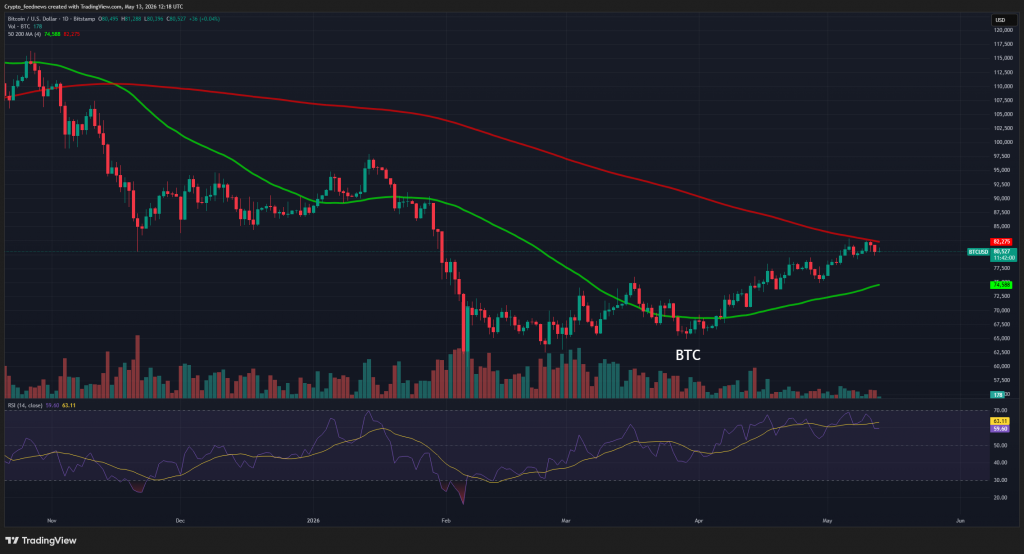
On the daily chart, Bitcoin trades within a broader ascending channel. This structure has remained intact since late March. Buyers repeatedly step in near the lower trendline support.
BTC recently bounced near the 0.5 Fibonacci retracement level around $80,180. This continues acting as a critical short‑term support zone.
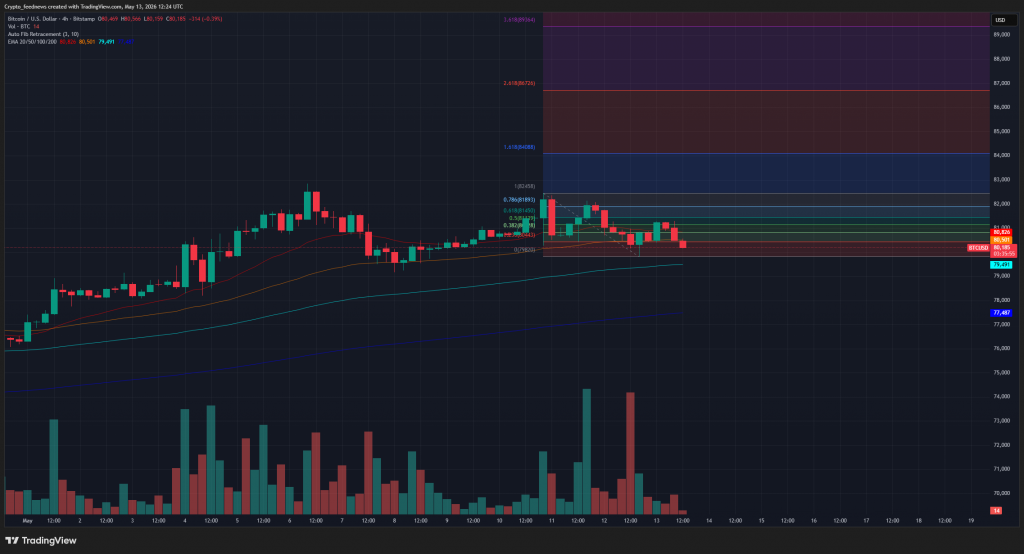
Bitcoin also stays above its 20‑day, 50‑day, and 100‑day simple moving averages. The Supertrend indicator holds bullish territory near $75,500.
However, the 200‑day SMA near $82,300 is immediate overhead resistance. It has capped upside attempts repeatedly.
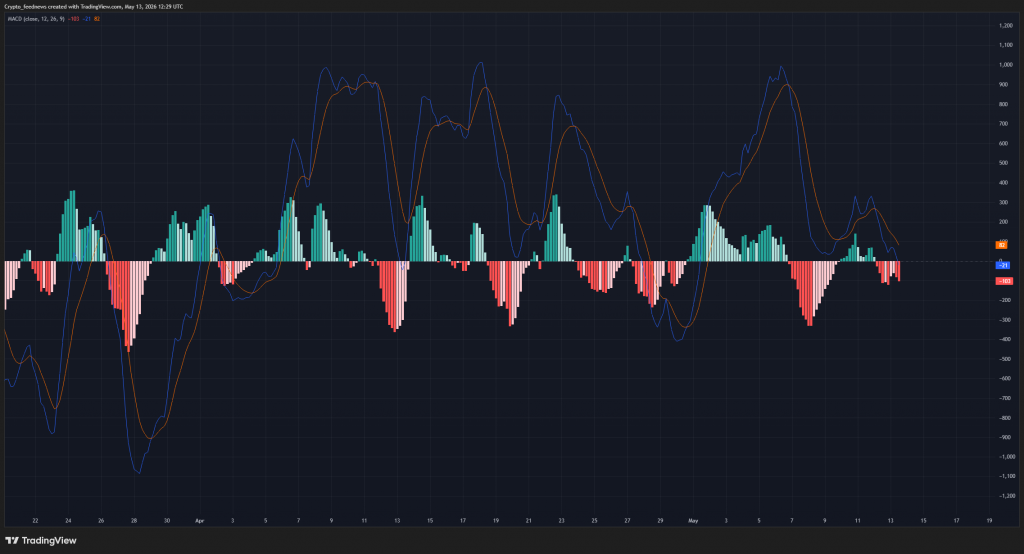
Momentum indicators show bullish pressure has cooled slightly. The MACD remains positive, but the histogram has flattened. This signals that upside momentum may be slowing as the market consolidates.
If bulls reclaim $82,300 decisively, Bitcoin could target $84,380 (0.618 Fibonacci). After that, the next zone is $85,000.
On the downside, losing $80,000 would weaken the ascending structure. That could expose BTC to a deeper move toward $76,000, where the 100‑day SMA and lower channel support converge.