
Ethereum under pressure continued on June 12. ETH traded at $1,672.70, down 0.69% over 24 hours, according to Coinmarketcap data.
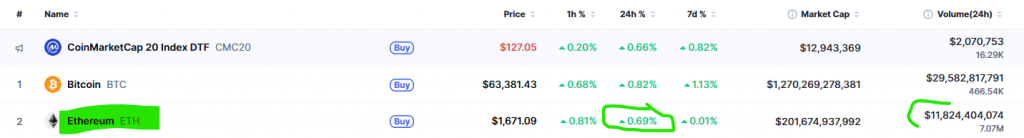
The token recorded $11.82 billion in daily trading volume. Meanwhile, its marketcap stood near $199.23 billion.
Why Ethereum under pressure persists
ETH traded between $1,632.77 and $1,687.85 during the latest 24‑hour period. Additionally, the token was down 4.91% over seven days. Therefore, short‑term weakness remains in place.
The current move follows a sharp June drawdown across the crypto market. Specifically, Ethereum recently touched the $1,500 area after losing support near $2,000. That level had acted as a major marker for traders.
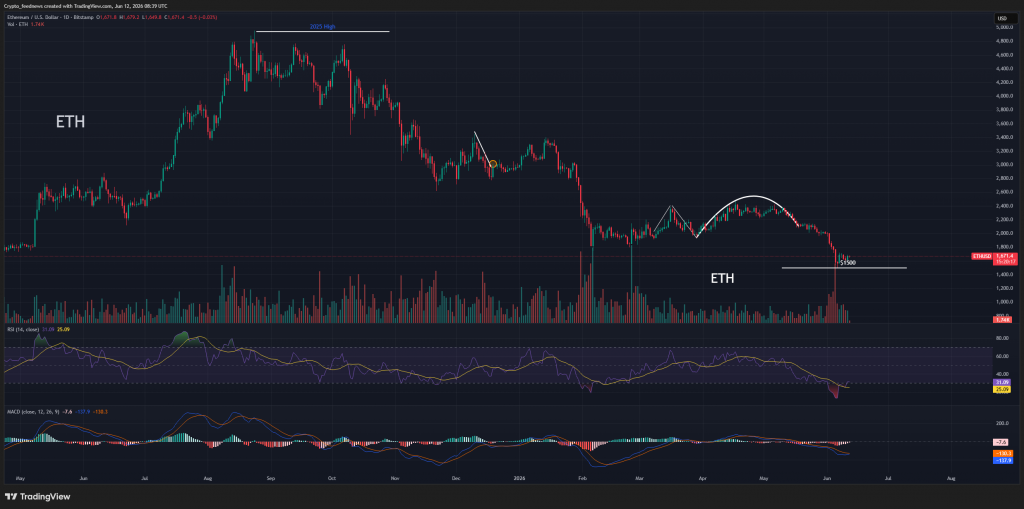
The daily chart still shows a clear downtrend. For example, ETH has formed lower highs since its previous peaks near the $4,500 to $5,000 region. Moreover, the latest price action shows consolidation near the lower part of the range.
Iran risk and Fed pressure weigh on Ethereum
Ethereum’s latest weakness came as U.S. military action against Iran pushed traders away from higher‑risk assets. Consequently, the conflict has lifted demand for the U.S. dollar and safe‑haven positions. At the same time, crypto markets have faced liquidations.
Higher energy prices also add pressure because they can keep inflation elevated. This matters for Ethereum because sticky inflation reduces the chance of easier Federal Reserve policy. A hawkish Fed usually weighs on crypto. Specifically, higher rates make speculative assets less attractive since investors can earn safer yields elsewhere.
As previously reported, the June crypto crash came from several pressures hitting the market at once. These included a hawkish Fed, U.S.‑Iran tensions, ETF outflows, and a leverage unwind. For Ethereum, that mix has been hard to absorb. Notably, ETH often moves with higher beta than Bitcoin. Therefore, it can fall faster when traders reduce risk.
Ethereum ETF outflows add market pressure
Spot Ethereum ETFs recorded $15.89 million in net outflows on June 11. That marked the third straight day of withdrawals, according to Farside Investors data.
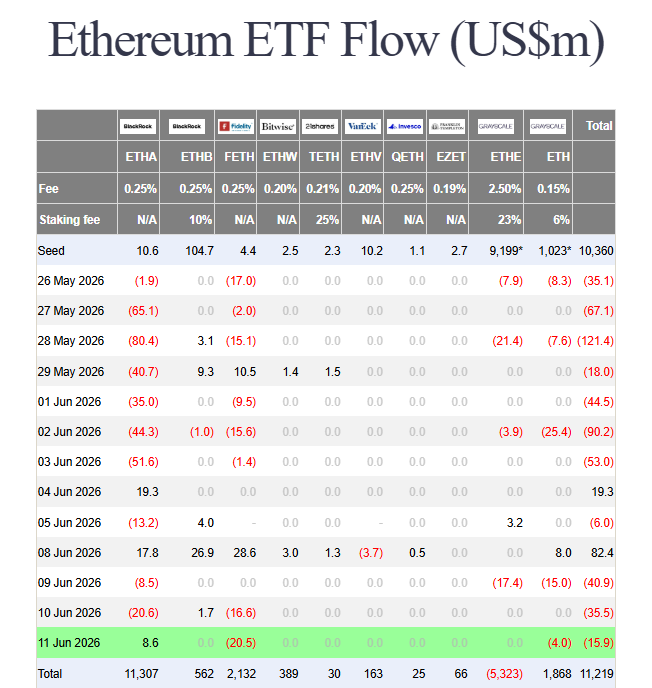
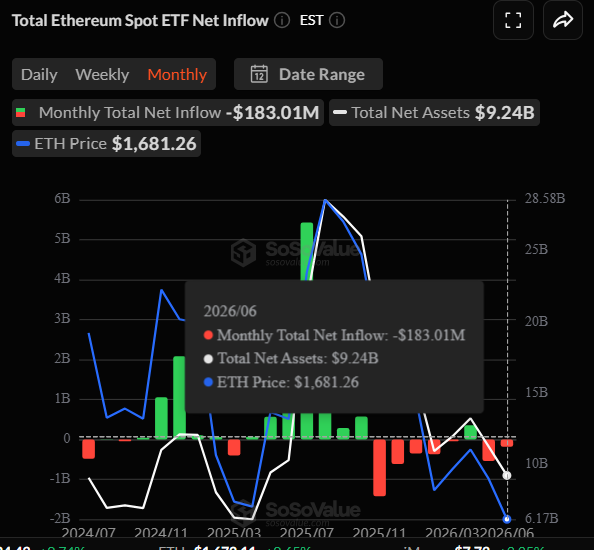
ETF outflows matter because these products can act as a source of spot demand. When flows turn negative, that demand weakens and can add sell pressure during unstable markets. For instance, spot Ethereum ETFs saw $540 million in outflows in May, followed by another $183 million in early June. Consequently, that removed a major source of support as ETH broke several key levels.
The outflow trend has also kept institutional demand in focus. Therefore, Ethereum bulls need ETF flows to stabilize if ETH is to build a stronger recovery from the $1,500 to $1,650 range. Nevertheless, the latest ETF data does not mean all buyers have left. For example, BlackRock’s ETHA still recorded inflows on June 11. However, broader net flows remained negative across the full group.
Analysts split on accumulation and downside risk
Some analysts argue that Ethereum has entered a long‑term accumulation zone. Specifically, Ali Martinez pointed to Ethereum’s MVRV pricing band and said ETH is trading below the 0.8 MVRV band. That has often marked undervalued conditions.
“Ethereum below the 0.8 MVRV Pricing Band is a high‑probability long‑term accumulation zone,” Ali wrote. He also noted that Ethereum’s Delta Price sits near $700. This metric compares investor cost basis with miner production cost and has historically appeared near deep cycle lows.
However, that view does not remove short‑term risk. For example, Daan Crypto Trades said ETH still needs to retake its range low before the structure becomes more constructive. “Still watching for that range low retake before getting excited again,” he said. He added that the current move still looks like another breakdown in a larger trend unless ETH reclaims the lost range. Therefore, attention stays on the $1,750 to $1,800 area.
Ethereum technical setup remains weak
Ethereum is trying to hold the $1,650 area. If sellers break that level, the next support zone sits near $1,550 to $1,500. A deeper move below $1,500 could bring the $1,400 level into focus. Some analysts have warned that failure to hold that region may increase the risk of a move toward to $1,100.
On the upside, ETH needs to reclaim $1,750 to $1,800 first. Furthermore, a stronger recovery would require a move back above $2,000, where the latest breakdown accelerated.
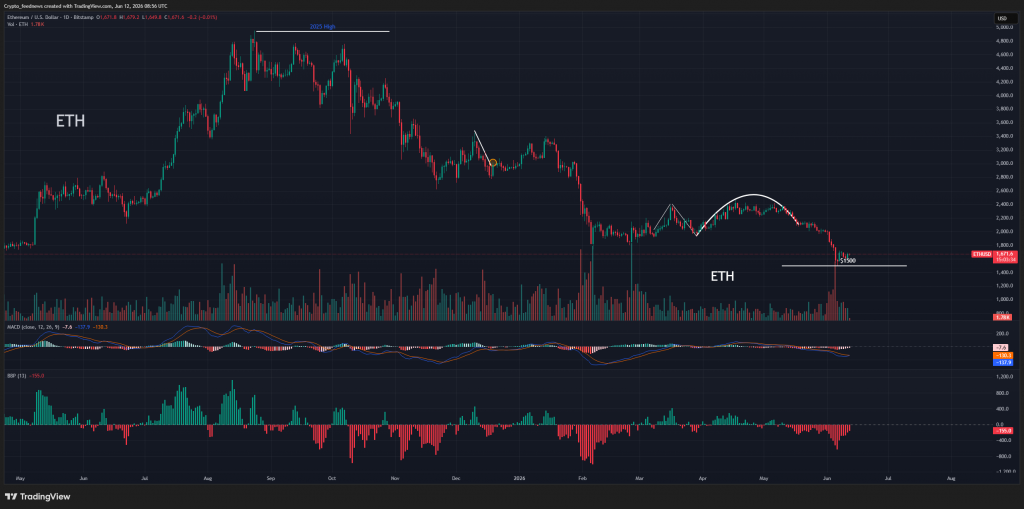
The BBP indicator remains negative near -155. This shows that sellers still control the daily chart. Nevertheless, the red bars have become smaller than the sharp bearish spike seen earlier in June. That suggests selling pressure has eased slightly.
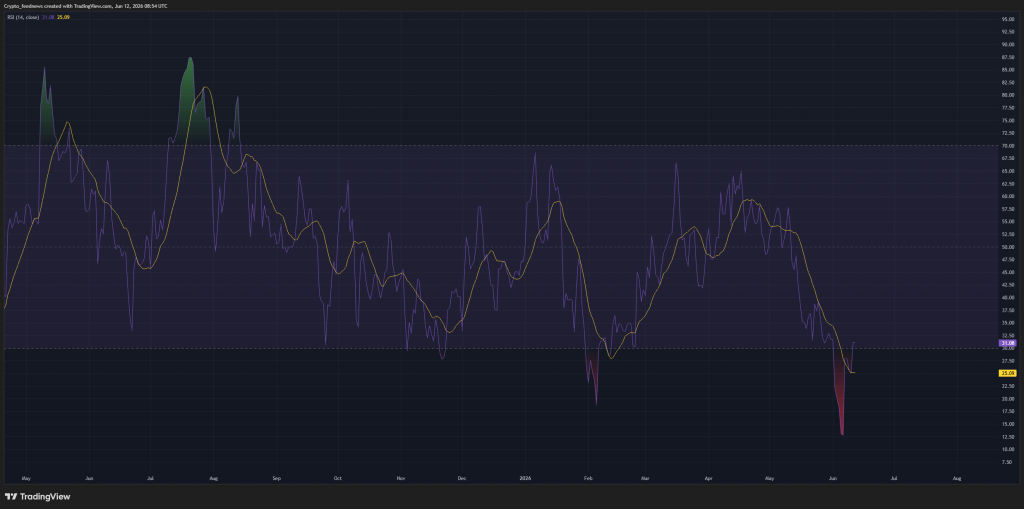
The RSI stands near 31.08, while its signal line is near 25.09. Therefore, ETH is close to oversold territory. This can support a short‑term relief bounce if buyers defend support. A stronger signal would require RSI to move back above 40 and then toward 50. Until then, momentum remains weak.