

Arbitrum price rebounds toward $0.15 on September 15. ARB rose nearly 9% after Standard Chartered initiated coverage.
The token tested a dense resistance zone near $0.155. Liquidation clusters also sit near that level.
Why Arbitrum price rebounds matters
Standard Chartered set a $10 target for the end of 2030. The report cited comments from research head Geoff Kendrick. Consequently, ARB recovered from its recent support area.
ARB traded near $0.14905 at the time of writing. It was up 8.75% for the daily session. The token opened at $0.1337 and fell to $0.1314. It then reached an intraday high of $0.1468.
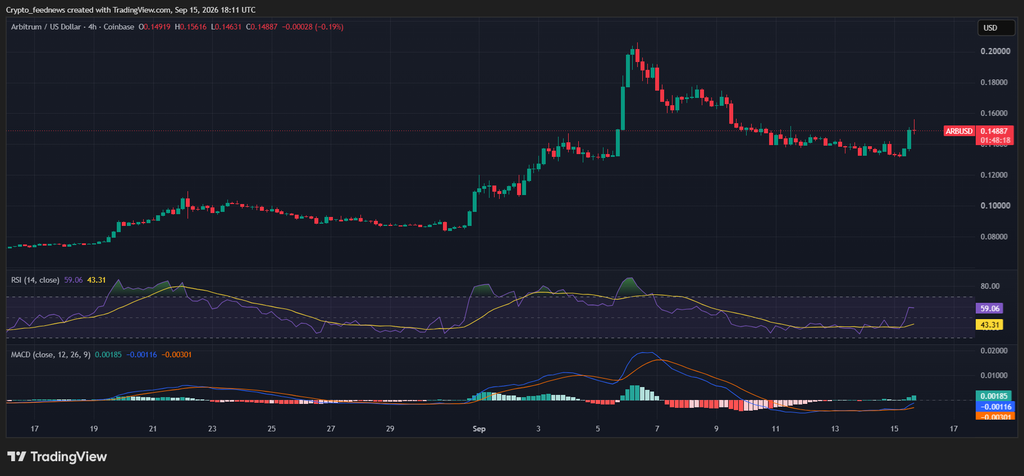
The 4-hour chart recorded a 5.9% gain during the latest candle. Price rose from $0.1374 to $0.1454. Buyers entered after several days of consolidation. ARB had traded between roughly $0.131 and $0.145.
The rebound followed a volatile start to September. ARB climbed from below $0.09 to about $0.20. Sellers then pushed it back toward $0.13. The daily chart still shows ARB below that monthly peak.
Standard Chartered sees tokenization supporting ARB
Kendrick described Arbitrum as a potential blockchain for traditional finance. He expects institutions to move assets on-chain. The bank expects tokenized assets to grow from $340 billion to $4 trillion. That growth would occur by the end of 2028.
Standard Chartered sees Robinhood Chain as evidence of this opportunity. That project uses Arbitrum technology. Therefore, the network gains exposure to tokenized financial assets.
Kendrick expects Arbitrum’s monthly revenue to reach about $5 million in September. That is more than five times its level before Robinhood Chain launched. He argued that higher revenue could support a new ARB valuation.
The bank set several year-end targets. These are $0.50 for 2026 and $1.50 for 2027. They also include $3.50 for 2028 and $6.50 for 2029. Finally, the bank set $10 for 2030. Each level remains a Standard Chartered projection.
A move from $0.1454 to $10 would require a gain of about 6,780%. ARB must also recover above several prior support and resistance areas.
ARB faces resistance near $0.155
The 4-hour Bollinger Bands show ARB reaching the upper band near $0.14691. Price also moved above the middle line at $0.1382. The lower band stood near $0.1310.
Closing above the middle band shifted the immediate structure in favor of buyers. However, trading against the upper band can invite a short-term pullback. This depends on whether demand continues.
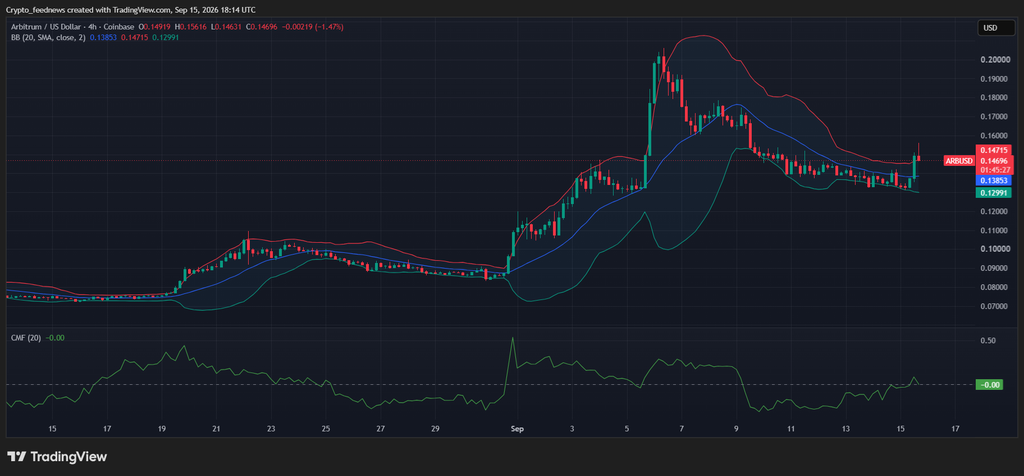
Chaikin Money Flow rose to 0.19 on the 4-hour chart. The positive reading shows stronger buying pressure during the rebound. It supports the move above $0.14.
Daily indicators offered a more cautious signal. ARB’s RSI stood at 58.82. That is above neutral 50 but below overbought 70. Its RSI average remained higher at 67.11. This reflects lost momentum after the early-September spike.
The daily MACD line stood at 0.0125. That is below the signal line at 0.0150. Its histogram slipped to minus 0.0025. Therefore, the broader bullish impulse has not fully recovered.
A close above $0.147 would expose the $0.150 psychological level. The one-week CoinGlass heatmap shows strong liquidation concentration around $0.154–$0.156. That area is the next major test.
Further liquidity appeared between $0.158 and $0.160. Separate clusters also sit near $0.166 and $0.170. A breakout through those zones could open a path toward $0.19–$0.20.
On the downside, $0.138 is the first short-term level to watch. It matches the 4-hour Bollinger midline. A loss of that level could return ARB to $0.131–$0.133. The lower Bollinger Band and recent lows converge there.
Analysts target $0.185 if support holds
Crypto analyst Michaël van de Poppe commented on ARB. He said it appeared to hold its first support level. He also said it was beginning to turn higher. He sees a possible sharp move toward $0.185 if ARB breaks out.
The $0.185 target sits near the upper part of ARB’s early-September range. Reaching it would require a gain of roughly 27%. ARB must also break above liquidation clusters near $0.155 and $0.170.
Altcoin Sherpa also identified the current area as support. He attributed ARB’s recent strength partly to Robinhood-related activity. However, he said the size of any continuation remained uncertain.
Both views depend on ARB holding its recent base. A daily close below $0.131 would weaken the recovery setup. It would also place the breakout targets at risk.
Robinhood gives the rally a US market angle
Robinhood provides the clearest US connection to Standard Chartered’s thesis. CEO Vlad Tenev has described the chain as built for real-world assets. This links Arbitrum’s technology to a US brokerage.
The long-term effect on ARB will depend on network use. Revenue generation and value capture by token holders also matter. Standard Chartered’s forecast assumes rapid tokenization growth. It also assumes Arbitrum becomes a preferred infrastructure provider.
For the immediate move, traders face a closer test at $0.154–$0.156. Holding above $0.138 keeps the short-term rebound intact. A confirmed break through $0.156 would strengthen the case for $0.17. It would also support the analysts’ $0.185 target.