
Bitcoin price bottom near realized price is what historical data suggests. On Thursday, BTC surged more than 2% despite rising US CPI inflation, ETF outflows, and Iran war escalation.
Consequently, the leading analytics firm CryptoQuant believes a structural floor may be approaching.
Why Bitcoin price bottom near realized price matters
Bitcoin has historically bottomed near its realized price. In this cycle, that level sits around $53,600. Therefore, BTC may be approaching a structural floor, according to CryptoQuant data.
CryptoQuant head of research Julio Moreno explained: “Historically, it’s a level that would confirm a bottom. It doesn’t mean that we necessarily hit it, but it is still a possibility, especially with bitcoin’s demand weakness.”
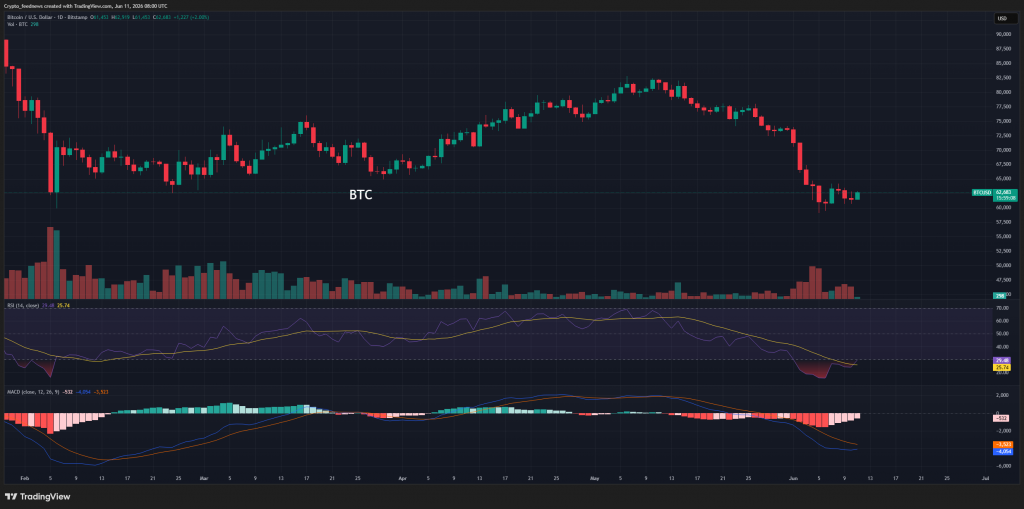
Last week, Bitcoin fell to a fresh bear market low of about $59,000. That left it just $62,150. This recovery followed monthly core CPI inflation coming in below expectations.
However, Moreno added that the bottom may be near in terms of price level. Yet, a shift into a bull market requires a “constructive demand recovery, a condition not yet visible in the data.”
For example, total demand must stabilize. Additionally, ETF flows need to recover. Realized losses must also reach capitulation level peaks. Therefore, the current price level should be interpreted as a potential bottom zone, not a confirmed cycle bottom.
Meanwhile, Glassnode noted that Bitcoin fell below $60,000 as profitability collapsed. Short‑term buyers sank into losses, and realized losses accelerated. In addition, institutional demand weakened, while options markets continued to price in elevated risk.
Four‑year cycle signals recovery is near
Benjamin Cowen, founder of Into the Cryptoverse, reiterated that Bitcoin’s four‑year cycle remains intact. He predicts Bitcoin will likely bottom near October, in line with historical midterm year patterns.
Specifically, Cowen claimed BTC could retest or dip below $60,000 again. Macro headwinds may delay recovery until late in the year. Nevertheless, he highlighted that Bitcoin is currently bouncing from the key 200‑week moving average.
Moreover, Bitcoin could form a double bottom on the daily chart, with massive support in that region. Analysts see a reversal could happen from these levels. For instance, massive trading volume and options traders’ demand are providing support.
In addition, Bitcoin is flashing a buy signal. It now trades in the Fibonacci Golden Zone on the weekly timeframe, which is a critical pullback area. The 200‑WMA in that region indicates potential recovery toward $70,000.
Finally, CoinGlass data shows massive buying in the derivatives market. Specifically, total BTC futures open interest jumped nearly 2% to $45.71 billion in the last 24 hours. BTC futures OI on CME, Binance, and OKX climbed almost 5%, 2%, and 4%, respectively. Therefore, bullish sentiment is returning among derivatives traders.