

Solana on-chain strength continues to grow. The network processed 8.7 billion transactions in July.
This is its highest monthly count in four months. Nevertheless, SOL price closed July down 1.1%.
Why Solana on-chain strength matters
SOL printed its 10th consecutive monthly red candle. This means since October’s breakdown, SOL hasn’t had a strong monthly close. HODLers who bought near $250 are deep underwater.
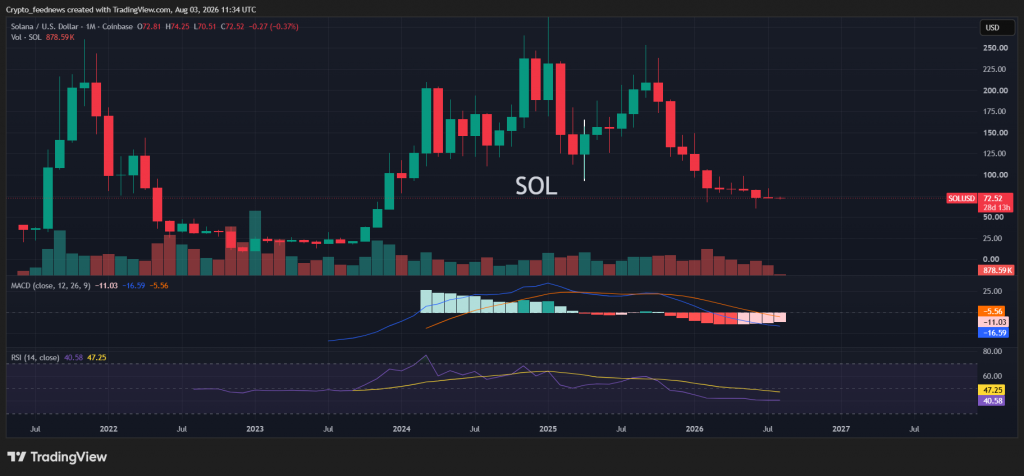
The $60 region is becoming critical long-term support. However, on-chain data shows a different picture.
Solana activated SIMD-0286 on July 29. This raised the compute limit from 60 to 100 million. The network now has more room to handle demand spikes.
The upgrade also eased fee pressure. The 90th percentile transaction fee fell 30%. It dropped from 29,800 to 20,800 lamports. This points to better throughput and improved capital efficiency.
Technical setup aligns with fundamentals
Solana is forming a breakout-and-retest structure. This pattern historically preceded its strongest rallies. In 2021, the pattern led to a 2,500% move. The 2023 setup led to a 3,600% rally.
SOL is once again holding high-timeframe support. The market could be building a similar structure for 2026-2027.
August and September are historically Bitcoin’s weakest months. This increases the odds of capital rotating into altcoins.
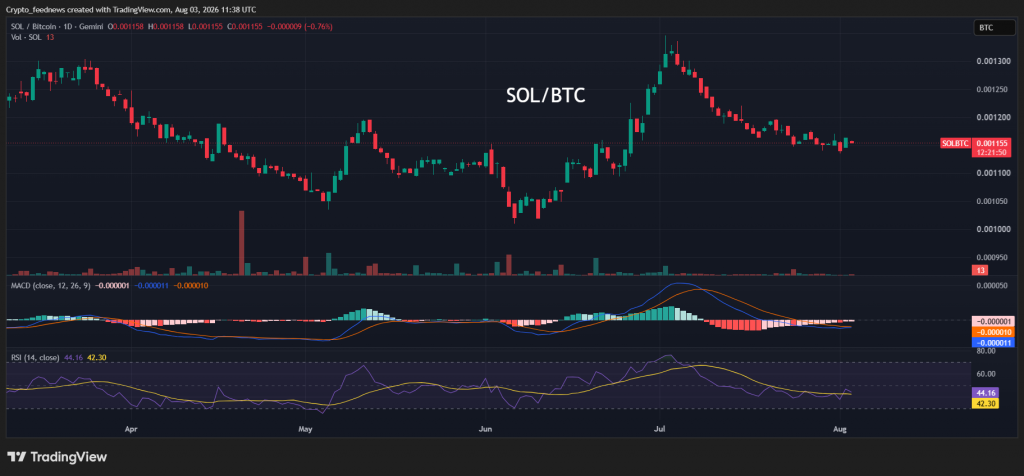
The SOL/BTC pair continues to chop below 0.002. A decisive breakout could mark a broader trend reversal.
Final summary
Solana is still in a downtrend. Nevertheless, network activity and fundamentals continue improving.
If Bitcoin weakens, money could move back into altcoins. The SOL/BTC pair could help Solana start a recovery.