


Ethereum price drops alongside the broader crypto market. Rising oil prices and US Treasury yields pushed investors away from risk assets on September 24. ETH fell 3% to $2,657 at press time.
Why Ethereum price drops despite ETF inflows
The drop came despite rising ETF inflows. Additionally, the Sepolia testnet launch is approaching on October 6. Therefore, the market faces mixed signals.
Ethereum sets October 6 testnet launch
Ethereum will complete its first public testnet for Glamsterdam on October 6. Specifically, the Sepolia testnet lets developers test compatibility. They will check whether Glamsterdam works with existing smart contracts.
Furthermore, a second testnet follows on October 27. The Hoodi testnet will test cross-chain interactions. If both phases pass, mainnet rollout follows before Q4 2026 ends.
Glamsterdam is one of the biggest upgrades since The Merge in 2022. It seeks to reduce transaction costs. It also aims to triple throughput. Meanwhile, Vitalik Buterin focuses on making the network quantum-resistant.
Ethereum’s 30-day volatility hits a 6-month high
CryptoQuant data shows Ethereum’s 30-day realized volatility rose to 0.73. Notably, this is the highest reading since March 2026. The increase came as ETH fluctuated between $1,800 and $2,800.
However, analyst Arab Chain noted something important. Rising volatility does not predict direction. Instead, it may precede stronger price movements.
Meanwhile, Ethereum recorded 6.94% returns in September 2026. That is the highest September return since 2016.
ETH ETFs record four consecutive days of inflows
Farside data data shows four straight weeks of ETF inflows. Therefore, this points to increased institutional demand. BlackRock’s ETHA is close to $10 billion. Specifically, it holds $9.7 billion in net assets.
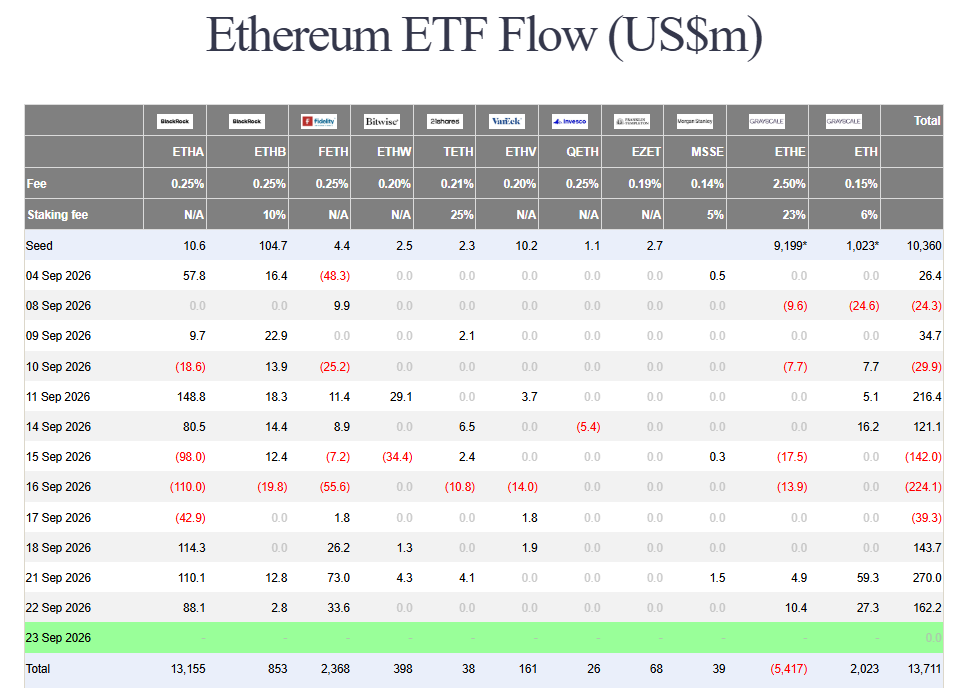
Additionally, Morgan Stanley’s Ethereum ETF launched in July 2026. It has amassed $53 million in inflows. That inches it closer to Franklin Templeton’s ETF at $59 million.
Ethereum price stalls after breaking 200-week EMA
Ethereum moved above the 200-week EMA at $2,459. This followed a surge in buying pressure. However, gains stalled, and ETH now retests that support.
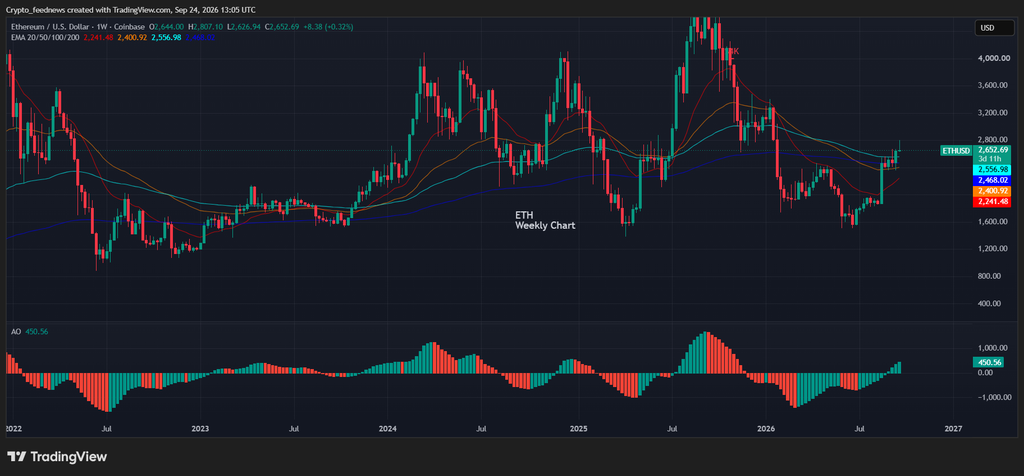
If support holds, ETH could target the 123.6% Fib at $2,940. If support fails, ETH could drop to the 50-day EMA at $2,400.
The AO bars are green, suggesting bulls have momentum. These bars are growing in length. Therefore, bulls may be tightening their grip.
What comes next for Ethereum price?
Ethereum faces competing pressures. Oil prices and Treasury yields weigh on risk assets. Meanwhile, ETF inflows and upcoming testnets support the network. Therefore, traders should watch the 200-week EMA closely. A hold could open $2,940. A break could send ETH toward $2,400.