


Ethereum price recovers toward $2,500 on September 18. Buyers defended support near $2,400.
However, the $2,550 area remains the main barrier. This applies to both daily and 4-hour charts.
Why Ethereum price recovers today
ETH traded around $2,500 at the time of writing. It is up nearly 3% over 24 hours. The intraday range stretched from $2,427 to $2,518.
The rebound followed a decline toward $2,385. Buyers pushed ETH back above $2,500. Nevertheless, this has not produced a confirmed breakout. The range has controlled price since late August.
US macro and regulatory conditions remain mixed. The Fed raised rates by 25 basis points this week. This happened amid persistent inflation concerns. Meanwhile, the Senate failed to advance the CLARITY Act.
Bitcoin and crypto stocks rebounded since those events. Therefore, both outcomes were partly priced in beforehand. ETH’s next move may depend on a technical breakout.

Ethereum price approaches the upper Bollinger Band
The daily chart shows ETH rising from $2,447 to $2,505. The session recorded a high of $2,522. The low was $2,437.
Ethereum now trades above the Bollinger Band midpoint at $2,467. That level could serve as first dynamic support. This applies if the recovery loses momentum.
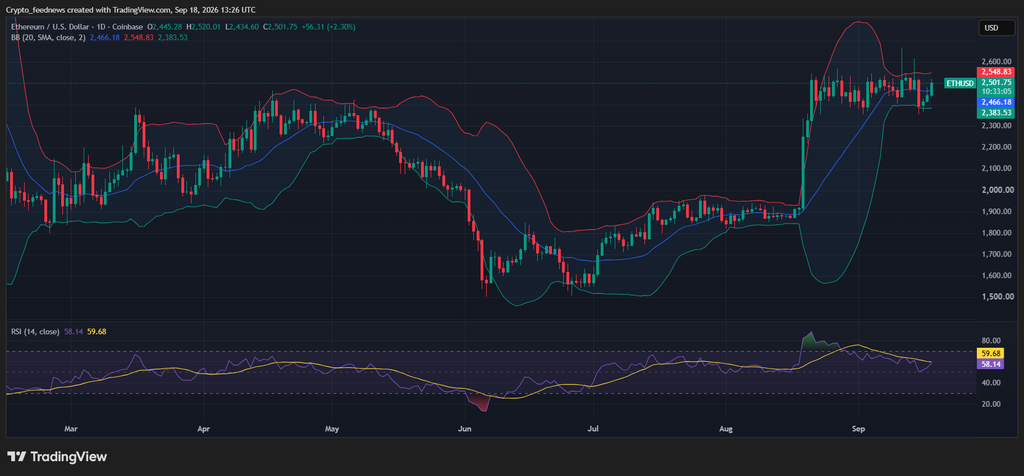
The upper Bollinger Band stands at about $2,549. That is close to the psychological $2,550 resistance. ETH has struggled around this region repeatedly.
A daily close above $2,550 would move price outside its recent range. The next resistance sits around $2,600. A broader supply zone between $2,700 and $2,800 follows.
Failure to clear $2,550 would keep ETH inside consolidation. In that scenario, the Bollinger midpoint near $2,467 becomes the first level. The lower band around $2,385 follows.
Daily relative strength remains positive. Nevertheless, it is not overextended. The RSI stands at 58.35. Its signal line is slightly higher at 59.74. A reading above 50 points to stronger buying momentum. However, the RSI below its signal line shows incomplete confirmation.
4-hour momentum improves below $2,527
The 4-hour chart shows recovery from the September 16 sell-off. Price briefly moved below $2,400 then. Since then, ETH formed higher short-term lows.
The Bull Bear Power indicator climbed to 85.09. This reflects renewed buyer strength. Positive histogram bars also expanded during the rebound.
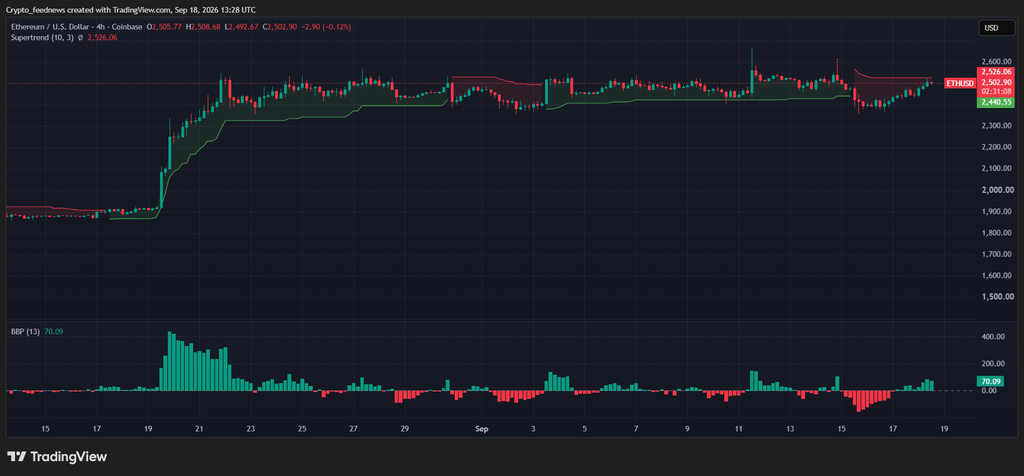
The 4-hour Supertrend remains bearish nevertheless. Its resistance line sits at $2,526.61. Ethereum must close above that level. Only then does the indicator favor buyers.
A move above the Supertrend would place $2,549 within reach. The two levels sit only about $23 apart. Therefore, the $2,527–$2,550 region is a wider resistance zone.
Support on the 4-hour chart rose to approximately $2,442. A break below would weaken the higher-low structure. It would expose the $2,400–$2,385 area again.
ETH liquidation map points to $2,630–$2,650
The one-week liquidation heatmap shows several leverage clusters. The closest liquidity sits around $2,490–$2,520. That matches the current trading area.
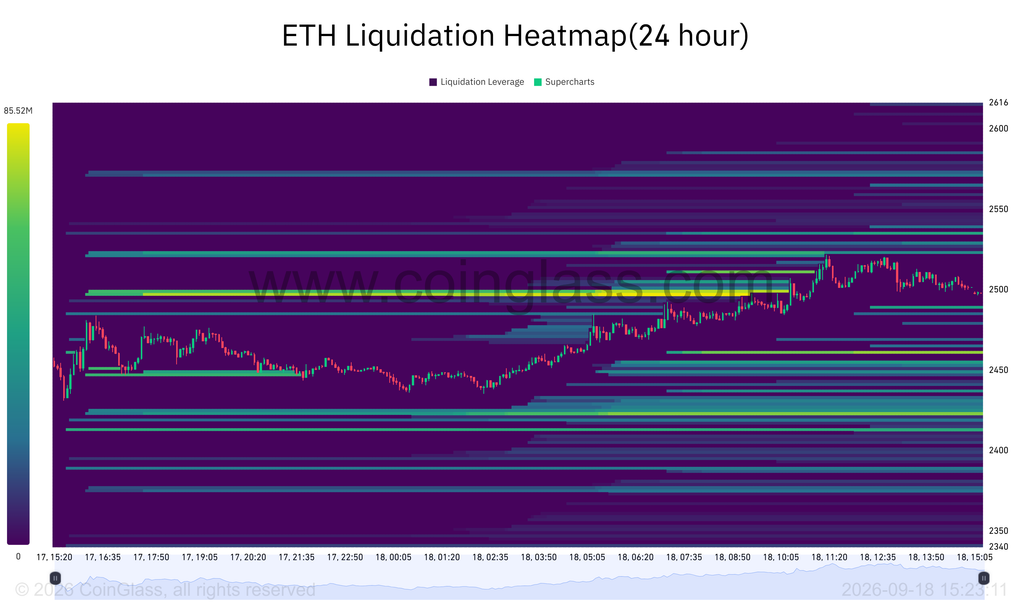
Larger concentrations appear above price near $2,630 and $2,650. The latter forms the brightest band on the chart.
Liquidation heatmaps show where positions may face forced closure. However, they do not predict price reaching those levels. If ETH breaks through $2,550, overhead clusters could add volatility.
Liquidity also appears below the market around $2,440 and $2,410. Those areas overlap with 4-hour Supertrend support.
A rejection at $2,550 followed by a loss of $2,440 could accelerate toward $2,400. Conversely, a confirmed breakout may open a path toward $2,600.
Analysts watch $2,550 for a larger breakout
Trader Batman described Ethereum’s structure as a “rally-base-rally” setup. He cited the consolidation after ETH’s August advance. His chart places the base near $2,385. The top of the range sits around $2,550–$2,600.
Analyst Ted Pillows also identified $2,550 as immediate resistance. He argued a weekly close above could support a move toward $3,000. Nevertheless, his chart places another major resistance near $2,800.
Both outlooks depend on ETH closing above its current ceiling. Until then, price remains inside a range. Support sits around $2,385–$2,440. Resistance sits between $2,527 and $2,550.
The short-term setup favors buyers while ETH holds above $2,467. A close above $2,550 would strengthen the bullish case. A reversal below $2,442 would shift attention back to $2,400 and $2,385.