


Ethereum rebounds on CLARITY Act hopes. The token rose 1.8% to $1,845.
Rep. Bryan Steil raised hopes for a Senate vote. The vote could happen next week.
Why Ethereum rebounds on CLARITY Act
Steil chairs the House Financial Services Subcommittee on Digital Assets. He told FOX Business about the bill’s timeline.
The bill could reach the Senate floor soon. Passage would place ETH under a digital commodity framework. It would also
establish federal trading rules.
Steil urged lawmakers to complete the legislation. “Let’s pass CLARITY,” he stated during a July 17 hearing.
Polymarket traders raised the bill’s odds to 39%. This is up from 30% on July 17. Nevertheless, unresolved disputes keep odds below 50%. Ethics rules and stablecoin yields remain sticking points.
ETF inflows and DeFi activity improve
Institutional flows have improved recently. SoSoValue data shows spot Ethereum ETFs attracted $105 million. This happened between July 13 and July 17.
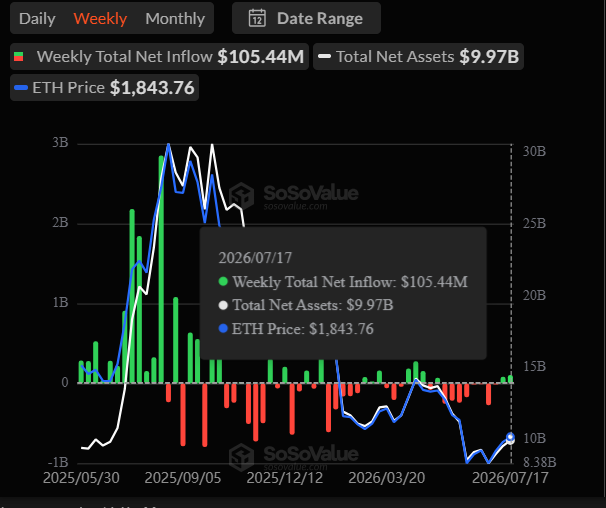
This marks the strongest weekly inflow since April.
Ethereum’s DeFi activity has also grown. DeFiLlama placed TVL at about $40.6 billion. This is up from roughly $36 billion at the start of July.
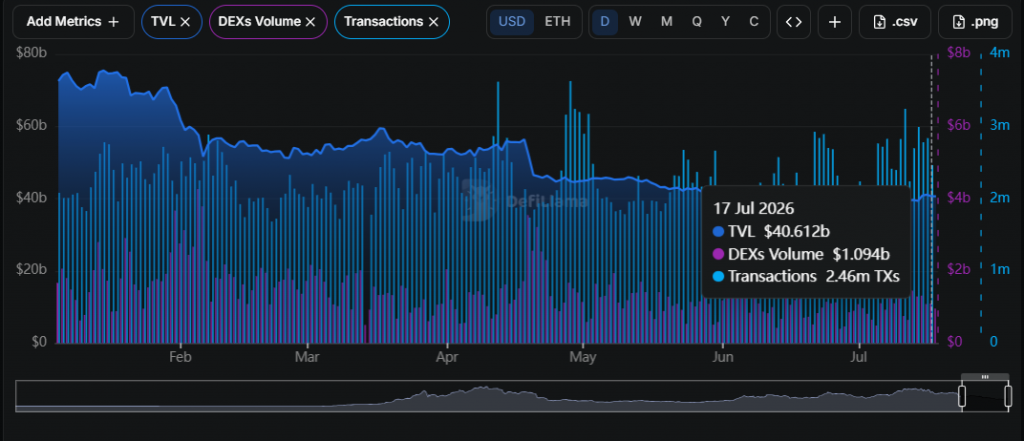
The network processed $1.09 billionin DEX volume. It also handled 2.46 million transactions over 24 hours.
Ethereum must clear $1,854 for further gains
Ethereum’s daily chart shows a double-bottom structure. This formed around $1,511. The neckline sits near $1,847.
ETH briefly climbed to $1,947 before returning to test the neckline. This now overlaps with the 0.786 Fibonacci retracement. That level sits at $1,853.82.
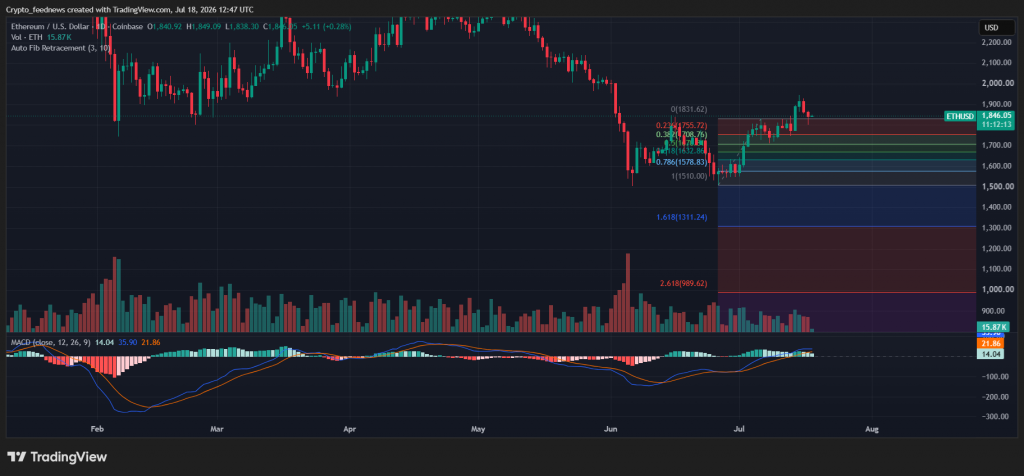
A daily close above $1,854 would put the recent high back in play. The 100-day EMA near $1,939 would also become relevant.
The double-bottom target sits near $2,180. Analyst Michaël van de Poppe expects $2,200 to $2,400. This requires $1,780 support to remain intact.
Daily momentum still favors buyers. The pace has slowed nevertheless. The MACD line sits at 35.57, above the signal line.
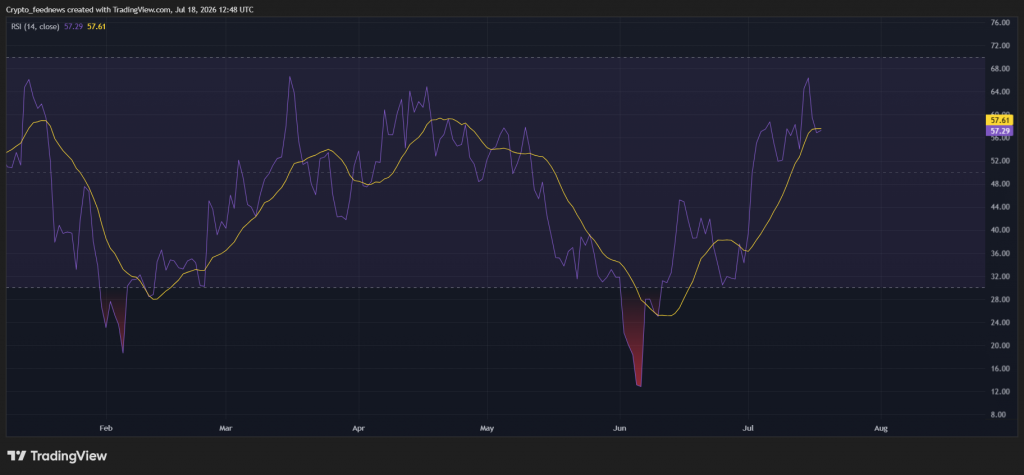
The positive histogram has contracted to 13.88. RSI sits at 57.25. ETH remains below overbought territory.
Four-hour chart shows ascending channel
Ethereum remains inside an ascending channel. This has guided recovery since late June. The lower boundary meets Supertrend support around $1,830.
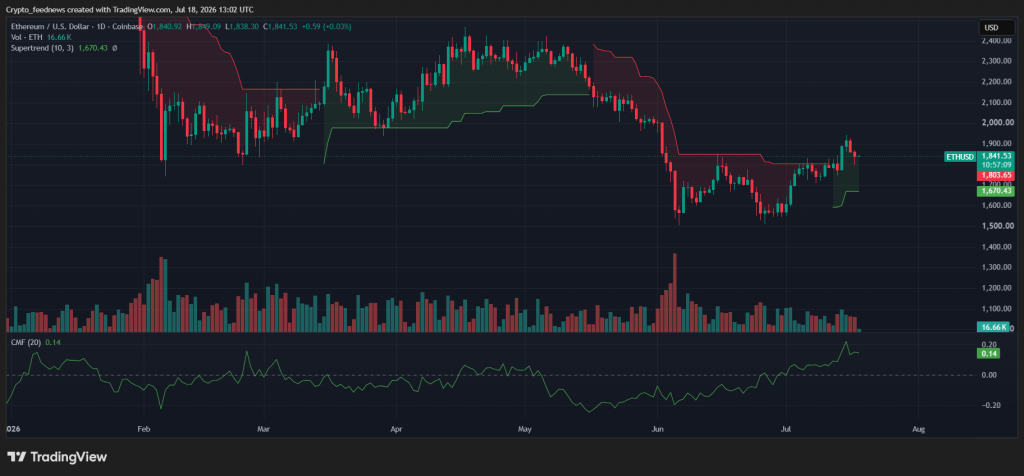
The upper boundary extends toward $2,040. Chaikin Money Flow remains positive at 0.07. However, active Supertrend resistance at $1,908 must fall first.
Key liquidation levels
CoinGlass shows dense leverage clusters between $1,860 and $1,870. More positions sit around $1,900. Downside liquidity has accumulated near $1,810 and $1,790.
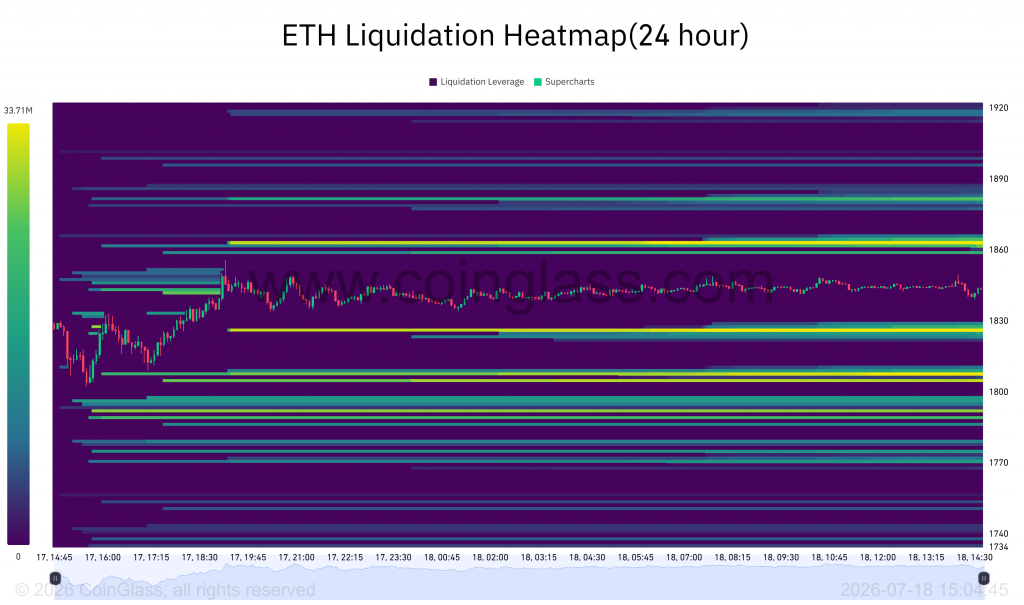
Analyst Ted Pillows says the $1,820–$1,850 region will decide ETH’s next move.
“If Ethereum holds above it, expect another uptrend towards $1,950–$2,000.”
Break below $1,780 could weaken recovery
Ethereum would lose its 4-hour channel below $1,830. This would expose the 50-day EMA near $1,812. It could also trigger leveraged long liquidations around $1,810.
A deeper decline below the 61.8% Fibonacci level at $1,780.64 would weaken the setup. This would open the 50% retracement at $1,729.24.
Pillows also cited the escalating US-Iran situation as a risk. Political uncertainty remains another invalidation risk.
Failure to resolve the CLARITY Act’s provisions could delay a Senate vote. This would remove the immediate catalyst. It could also place the $1,780 support under renewed pressure.