


Solana price breaks $100 on August 28. SOL traded near $106 after reaching $110 earlier.
Strong US ETF inflows and network activity helped defend the breakout. This happened despite hotter inflation data.
Why Solana price breaks $100 today
SOL rose as high as $110 before retreating to around $104.75. It is approximately 10% above its August 26 opening price of $96.60. SOL briefly fell to $95.23 earlier in the period. Buyers then restored the uptrend.

The recovery followed a strong advance that began around August 19. SOL broke out of a prolonged range near $75–$80. The token subsequently cleared $88, $94, and the psychological $100 level. Buying pressure accelerated through these levels.
Friday’s pullback started after SOL tested the $109–$110 area. This is the 4-hour chart’s latest local high. The decline of about 3.4% from that peak points to profit-taking. It does not indicate a confirmed reversal.
SOL remains above an ascending trendline. This line connects the higher lows formed since August 19. Its 4-hour Supertrend also remains bullish. Dynamic support sits at approximately $100.95. A drop below both levels would provide the first warning of weakening structure.
The Awesome Oscillator stands at 8.82, well above its neutral line. Its positive reading shows recent upward momentum remains stronger. Nevertheless, the latest red bar suggests the pace has started to cool.
ETF inflows help SOL absorb inflation pressure
Solana’s rebound developed despite a difficult inflation backdrop. The BEA said headline PCE rose 3.7% annually in July. This compared with a 3.6% consensus estimate.
Core PCE increased 0.2% monthly and 3.3% annually. This matched forecasts. The slightly hotter headline reading initially pushed bond yields and the dollar higher. Traders reduced expectations for easier Fed policy.
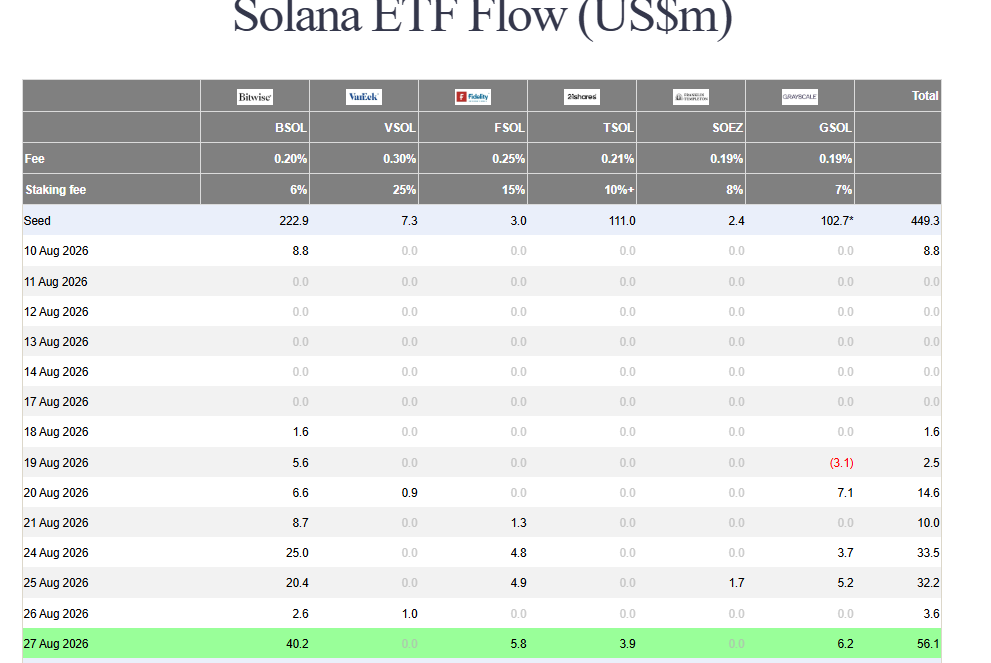
SOL fell to $95.23 after the report. Nevertheless, it recovered quickly as spot demand offset the initial de-risking. US spot Solana ETFs extended their inflow streak to five sessions through August 24. They attracted $33.5 million, their largest daily intake of 2026.
The inflow took cumulative net subscriptions to approximately $1.22 billion. Later data placed the streak at seven sessions. Cumulative inflows approached $1.26 billion.
Growing ETF demand gives US investors regulated exposure to SOL. They do not require direct token custody. It may also strengthen spot-market demand when fund issuers acquire the underlying asset.
Solana network activity strengthens the rally
Network activity has provided a second source of support. Solana processed more than 1.3 billion transactions during one week in August. This milestone points to high chain usage. Transaction totals can include automated activity nevertheless.
Tokenized-equity trading has also expanded. Solana processed $1.298 billion of the $1.324 billion in global onchain equity volume. This represents about 95% of the market during the week of June 15–21.
First-half tokenized-stock volume reached a reported $4.9 billion. This is more than six times the $775 million recorded in the second half of 2025. The comparison shows longer-term growth rather than a sixfold increase during the latest price rally.
SOL needs to hold $104 to target $115
The daily chart places SOL just above the 50% Fibonacci retracement level at $104.41. Holding that former resistance as support would preserve the breakout. This would give buyers another opportunity to challenge $110.
Momentum remains bullish but stretched. The Aroon Up indicator stands at 98.86%. Aroon Down is 14.29%. This confirms that the most recent high is much newer than the latest major low. Chaikin Money Flow is positive at 0.32. Accumulation has outweighed distribution during the measured period.
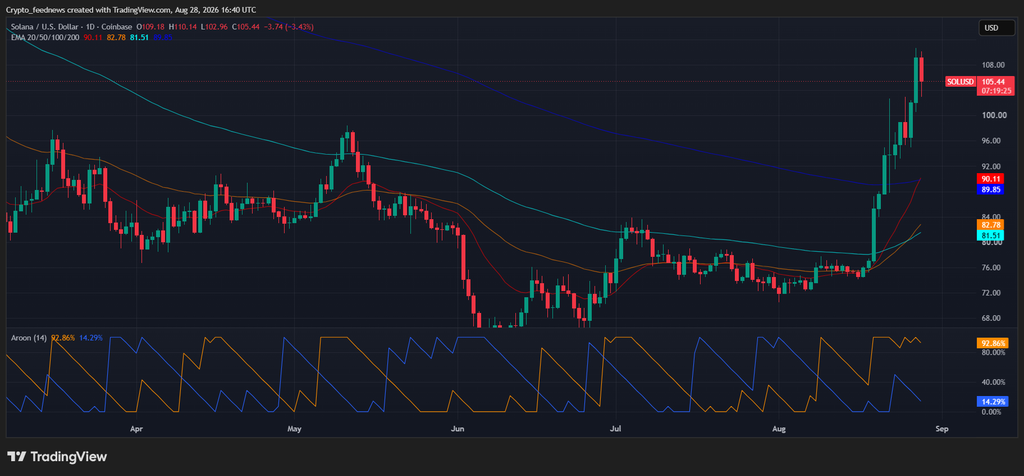
A confirmed daily close above $110 would expose the 38.2% Fibonacci retracement at $114.88. Clearing that level could extend the rally toward $127.83. The 4-hour rising trendline points toward the $111–$112 area in early September.
Liquidation levels to watch
The 24-hour liquidation heatmap shows overhead liquidity concentrated around $108.50–$109. Another cluster sits near $110.50–$111.50. A move through those zones could force short positions to close. This would add momentum to a breakout.
Liquidity is also visible below the market around $104–$105. Deeper concentrations sit near $102–$103. A loss of $104.41 could therefore pull SOL toward $100.95. The 61.8% Fibonacci level at $93.95 would follow.
SOL’s broader setup remains bullish while price holds above $100–$104. Nevertheless, rejection at $110 and stretched daily momentum pose risks. Nearby downside liquidity leaves the token vulnerable to a deeper reset. This could happen before any attempt at $114.88 or $127.83.