

Solana price stalls near $76 on Monday. The token failed again to break above $80.
Ecosystem exploits and weak momentum weigh on sentiment. Geopolitical stress also keeps traders cautious.
Why Solana price stalls at $76
Solana traded at $76.12 at the time of writing. It is down 0.34% on the daily candle. The token moved between $75.50 and $77.40.
It gained only about 0.3% over the past week. The global crypto market rose 3% in the same period.
Security concerns weighed on sentiment throughout July. An attacker drained roughly $20 million from BonkDAO. The attacker spent about $4.4 million on BONK. This allowed them to pass a malicious proposal. Only seven wallets voted. The proposal received 99.9% approval.
Another attack hit Allbridge Core on July 20. The exploiter borrowed $1.12 million in USDC. They manipulated the protocol’s USDC-USDT pool. They extracted more than $1.1 million. The attacker routed funds through privacy tools. Total liquidity loss is near $1.65 million. Allbridge paused the protocol immediately.
Phantom also reported degraded performance on July 12. Token transfers and swaps were affected. Account balances remained available. The disruption added friction for users.
Network activity has provided little relief. Trading on Pump.fun has fallen from previous peaks. Stablecoin balances may offer deployable capital. However, holders must exchange for SOL first.
Solana price must reclaim $80 to confirm recovery
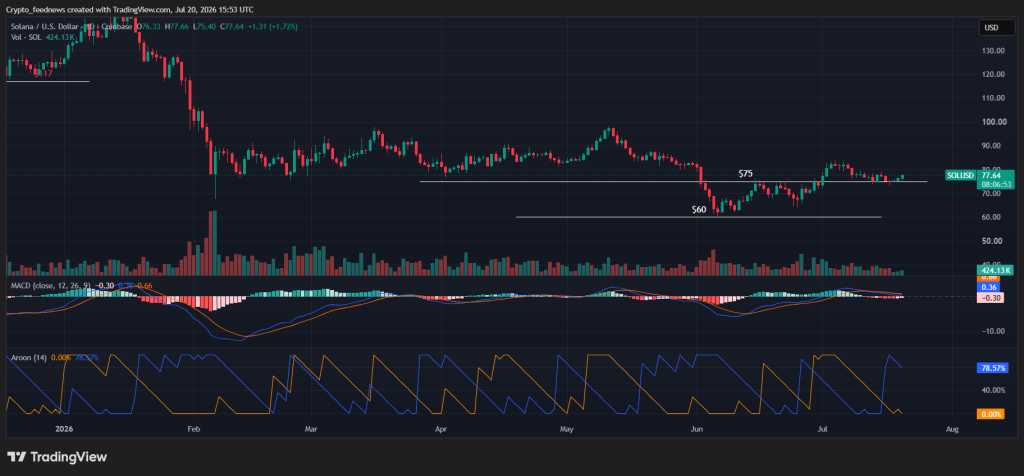
The daily chart places main resistance at $79.96. Early-July recovery failed at this level. Sellers pushed price back toward $75. A daily close above $80 would clear the psychological barrier.
This would reopen the route toward the July swing high. That sits around $83. The $90–$98 region would follow.
Analyst Daan Crypto Trades shared his view. “Either the bulls push through and set a higher low here,” he said. “Or this rejects here and dribbles back down to that mid $60s area.”
Daily momentum weakened since the early-July rally. The MACD line dropped to 0.23. It is below the signal line at 0.63. The histogram slipped to minus 0.40.
Buyers still control the medium-term structure. The daily Supertrend is at $69.62. Nevertheless, the bearish MACD crossover leaves SOL exposed.
Technical levels and liquidation clusters
SOL remains inside a descending parallel channel. This began after the July 3 peak near $83. Price reached the upper boundary around $76–$77.
A confirmed close above the trendline is necessary. Conflicting momentum readings keep the setup unresolved.
Aroon Down stands at 78.57%. Aroon Up is at 14.29%. Sellers have the stronger recent trend reading. Chaikin Money Flow sits at 0.23. Net capital flow remains positive nevertheless.
The one-week liquidation heatmap shows concentrated leverage. This is above the market at $77.50–$78.20. Another dense band sits near $78.80. A move through these levels could force short liquidations. This would help SOL retest $80.
Smaller liquidity pockets sit near $76.40. Downside clusters around $74.20–$75 could draw price lower.
Break below $73 would invalidate recovery
Immediate support rests at $75.41. The stronger daily level is at $73.44. A close below this would weaken the higher-low structure.
This would expose the lower edge of the 4-hour channel. That sits near $71. The Supertrend at $69.62 is the last major defense.
Macroeconomic conditions also threaten the setup. Renewed US-Iran hostilities pushed oil above $90. US gasoline prices returned to $4 per gallon. Higher energy costs keep inflation elevated.
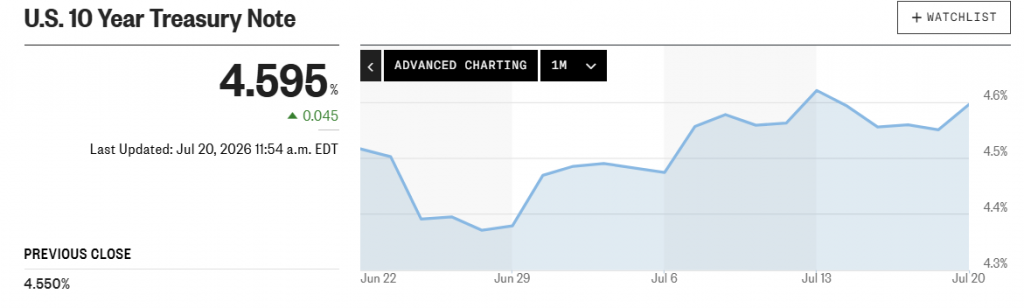
The 10-year Treasury yield rose to 4.59% on July 20. The dollar index held near 100.8. Persistently high yields keep institutional portfolios defensive. This restricts capital flows into volatile altcoins.
For bulls, the clean confirmation is clear. A daily close above $80 is required. A successful retest would follow. Until then, SOL remains trapped between $73 and $80. This defines the next decisive range.