

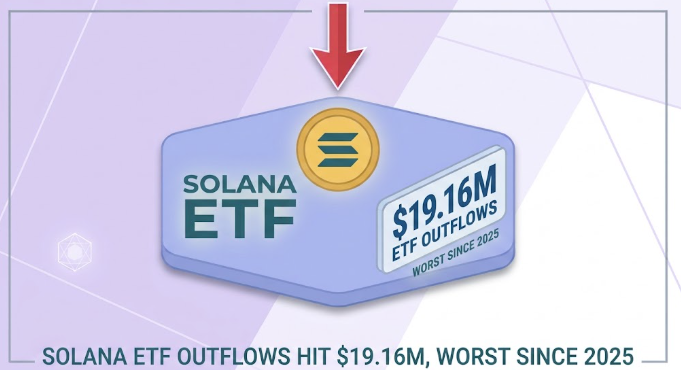
Solana ETF outflows reached $19.16 million on Tuesday, October 27. This was the largest daily outflow since December 3, 2025.
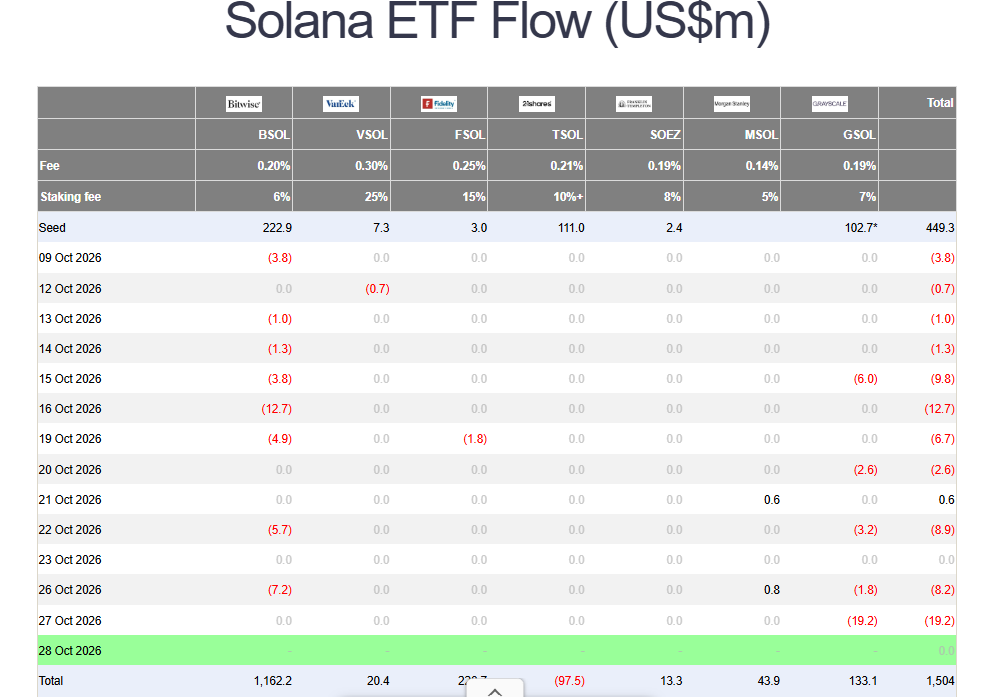
The selling comes as SOL trades at $101.87. Therefore, the token sits less than $2 above the key $100 support level.
Why Solana ETF outflows matter
SoSoValue data shows only one session topped Tuesday’s exit. That was the $32.19 million outflow on December 3, 2025. Additionally, $8.23 million left on Monday. As a result, the funds are on track for their worst week since launch.
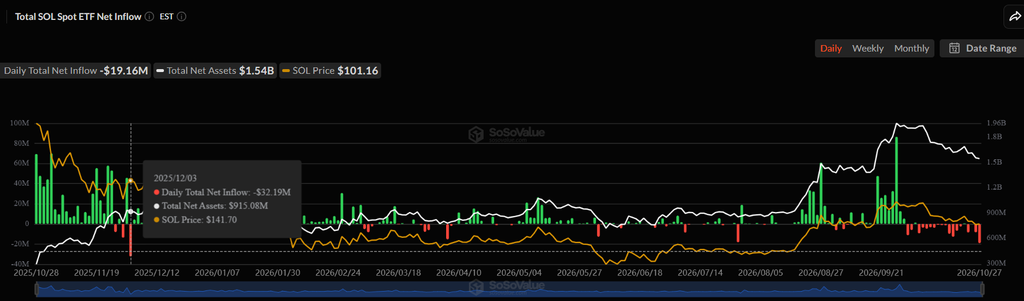
This week’s $27.38 million loss already exceeds recent weeks. Specifically, $25.52 million left in the week ending October 16. Also, $24.81 million exited in the week ending October 9. That outflow ended a 14-week buying streak.
Month-to-date outflows have reached $99.62 million. June, the only other negative month, lost about $787,000.
Total net assets fell to $1.54 billion from $1.96 billion on September 25. Cumulative net inflows dropped about $93 million over that period. Therefore, SOL’s falling price accounts for most of the decline.
Can SOL hold the $100 line?
SOL has fallen 13.8% so far in October. Consequently, it is on track for its eighth losing month of 2026. Over the past week, it is down 3.7%.
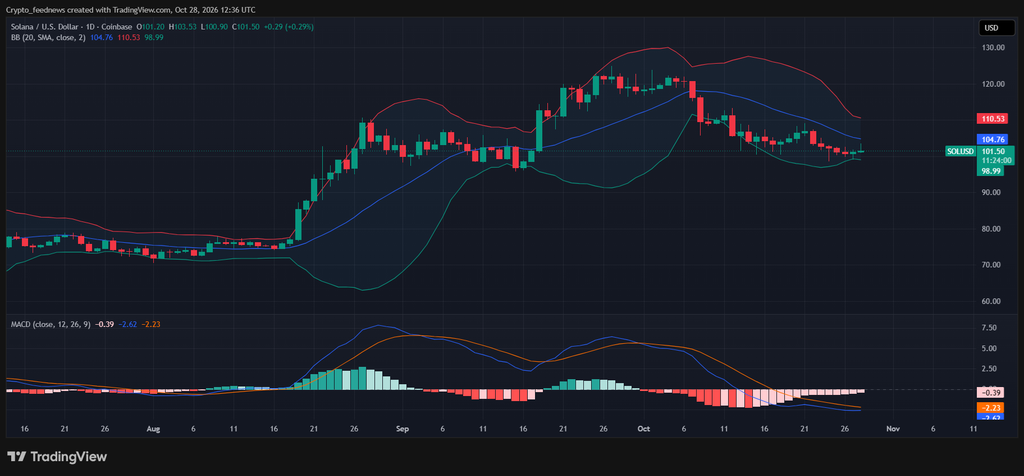
On October 21, SOL traded near $106. Analysts flagged a possible head-and-shoulders pattern then. The neckline sat near $100. A daily close below that level would confirm the pattern. That could put $80 in play.
MCO Global Research places hourly support between $98.86 and $100.47. The swing low sits at $98.62. The firm says a new low would add evidence for further downside. Conversely, a move above $109.20 would undo its bearish count.
According to CryptoRank data, November has historically favored SOL. The median gain is 15.3% since 2020. However, last November the token fell 28.3%. That happened even as newly launched ETFs drew $419.38 million. That was their biggest month on record.
That precedent shows ETF demand alone did not protect the price a year ago. Now the funds are selling amid volatility. Therefore, whether spot buyers absorb those redemptions may decide if the head-and-shoulders confirms.
Key levels to watch
Support sits at $98.86 to $100.47. Resistance sits at $109.20. A break below $100 could target $80. Therefore, traders should watch those levels closely.